


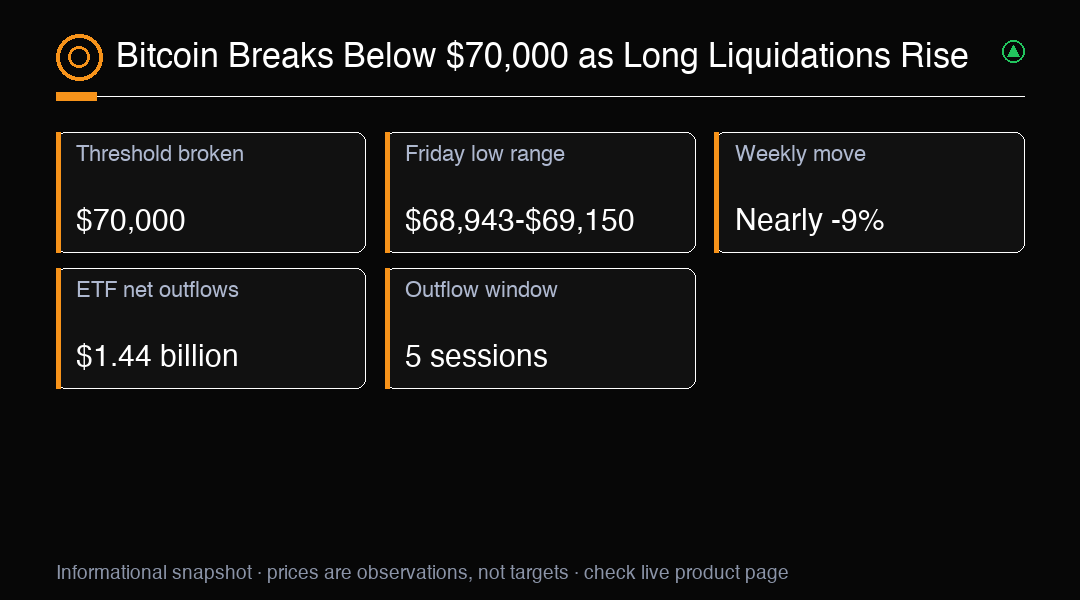
Bitcoin fell below $70,000 during the November 13 to November 13 selloff, breaking that threshold for the first time since mid-August. The move returned a widely watched round number to the centre of market attention. Bitcoin declined more than 3% on Thursday and was on course for a weekly loss of nearly 9%. That weekly figure was still developing and should not be read as a completed result. If the loss held through the weekly close, it would mark a sixth consecutive losing week. Until that close, traders are assessing an unfinished period, not a confirmed six-week sequence. The distinction matters because intraday weakness and a weekly close measure different spans of market activity.
A threshold break is a price event, but its interpretation depends on what happens around the level afterward. A move below $70,000 can prompt traders to reassess where demand may appear and how much risk they are willing to carry. The round number itself does not determine fair value or require further selling. Price could remain below it, recover above it, or move back and forth as participants test available liquidity. A brief dip and a sustained period below the threshold are not equivalent signals. The first records that price crossed a reference point; the second would show that trading continued under it for longer. Neither observation alone settles the broader direction.
Friday’s reported intraday low varied across accounts, with figures ranging from approximately $68,943 to $69,150. That range is more informative than choosing one precise low without a shared exchange and timestamp. Different venues can record different prices, and measurement windows can capture different moments. As a result, a low reported by one account need not match another account’s figure, even when both describe Friday’s trading. A separate $67,500 figure is not used here as Friday’s low because it appears to relate to a different date, exchange or measurement window. Keeping those observations distinct helps avoid treating unlike measurements as one agreed price. It also keeps chart discussion tied to the verified range.
The weekly performance adds a separate test of persistence. A nearly 9% decline, if sustained through the close, would extend the run of weekly losses to six. Before the close, however, that outcome remains conditional. Late-week strength could change the final result; continued weakness could leave the period with the prospective loss intact. This is why weekly-close confirmation can be useful alongside intraday monitoring. It gives traders a consistent point at which to assess whether the week finished below its prior reference, rather than assigning lasting significance to every temporary move. A close cannot explain why price moved, but it can confirm whether weakness persisted across the full weekly measurement period.
Fund flows provide another lens on demand, with their own dates and limits. US spot Bitcoin exchange-traded funds recorded approximately $1.44 billion in net outflows over five sessions through November 11. On November 11 alone, net outflows were approximately $299.8 million, including about $269.7 million from IBIT. These amounts describe recorded activity within defined windows. They do not establish why investors moved capital, and they do not prove that each outflow became an immediate spot-market sale. The five-session total ends on November 11, while the price break occurred during the November 13 to November 13 selloff. That sequence should remain clear when comparing the measures.
ETF flow windows and price windows do not line up automatically. A five-session flow total summarizes activity across those sessions, while a single-day figure isolates one date. Neither provides a continuous account of every trade or explains the decisions behind aggregate flows. Analysts can compare these figures with price behavior, but should avoid presenting timing as proof of cause. Outflows may coincide with reduced demand, portfolio adjustments or other activity that aggregate data cannot distinguish. If later flow data cover a different period, comparison requires attention to the dates and the number of sessions measured. Reading flows this way makes them a context for market conditions, not a stand-alone direction signal.
Leverage can make a threshold break more consequential for traders holding positions that move against them. When a leveraged long position is liquidated, the position is forcibly closed under the relevant platform’s rules. This can add short-term selling pressure and make price action more abrupt, especially when available liquidity is limited. The effect is not identical across every market or venue. Different platforms can use different rules and measurement windows, so liquidation reports may count activity over different intervals. Published totals varied sharply by provider and window in this selloff. The direction of reported pressure is clearer than any single combined total: long positions accounted for most reported liquidations, while the precise scale depends on how and when each provider measured it.
Liquidation windows matter because a short interval and a longer interval can describe different portions of the same move. Reports may cover different start and end times, include different venues, or update on different schedules. Adding such figures together without checking their scope can create a total that sounds precise but is not comparable. A liquidation reading also measures forced position closures, not all market buying and selling. It does not identify a durable low or establish what price will do next. After a liquidation-heavy move, traders can observe whether selling slows, whether price recovers lost ground, and whether later declines bring similar pressure. Those observations describe changing conditions without turning one reading into a forecast.
Liquidity helps explain why similar orders can have different price effects under different conditions. When fewer willing buyers or sellers are available near the current price, trading can move through nearby levels more quickly. This is a general market mechanism, not a claim about a measured liquidity level in this selloff. A break below $70,000 therefore deserves attention, but the speed of the move does not by itself show how much underlying demand remains. Traders can monitor whether transactions continue below the threshold, whether price can return above it, and whether any recovery holds. These are conditional observations. A single touch or brief crossing is weaker evidence of sustained acceptance than behavior that persists across the chosen measurement period.
Chart scenarios should be framed as conditions to monitor rather than outcomes to expect. A recovery above $70,000 could show buyers willing to transact back through the round number. A brief move above it would not, by itself, confirm a lasting reversal; follow-through and the weekly close would provide additional context. Continued trading below the threshold would keep the break relevant, while leaving direction unresolved. Some chart-based analysis may refer to $71,500 and $65,000 as scenario levels. They are reference points for conditional discussion, not verified outcomes, guarantees or forecasts. Movement toward either would require price action to develop. If observed behavior changes, the scenario and its interpretation should change with it.
For now, the evidence consists of a threshold break, a nearly 9% prospective weekly decline, recent ETF net outflows and long-dominated reported liquidations. Each measure describes a different window. The weekly loss is not final, Friday’s low is a range rather than one agreed print, and liquidation totals depend on provider and measurement period. These limits shape how confidently the signals can be combined. Traders can track whether price holds or reclaims $70,000, whether weekly weakness remains at the close, and how subsequent flow and positioning data are measured. That process helps distinguish observed evidence from inference. It does not remove uncertainty or make any one level a reliable prediction of what comes next.
Trading Insight
Bitcoin’s break below $70,000 came alongside recent ETF net outflows and long-dominated liquidations, but those measures do not establish what comes next. Watch whether price can sustain a recovery above the threshold and whether weekly weakness persists through the close.