


KEY POINTS: Bitcoin traded around $84,200 early Wednesday, down from the $87,363 resistance test earlier in the week. Rising oil prices and elevated Treasury yields pressured risk-sensitive assets. Spot Bitcoin ETF flows remain positive despite the pullback.
Bitcoin slipped below $84,000 on Wednesday as rising oil prices and elevated Treasury yields pressured risk-sensitive assets. The cryptocurrency traded around $84,200 in early Wednesday session, down from the $87,363 resistance test earlier in the week. The retreat from the recent consolidation near $87,000 has shifted momentum back in favor of sellers, with the $87,363 level proving to be a stubborn barrier that buyers could not overcome.
Rising oil prices have complicated the inflation outlook and kept pressure on risk assets. Brent crude rebounded above $101 per barrel, raising input costs across the economy and squeezing consumer purchasing power. Higher energy prices feed directly into transportation, manufacturing, and agricultural costs, creating a secondary inflationary impulse that central banks cannot easily address through interest rate policy. The timing is particularly unwelcome for Bitcoin, which had been consolidating near $87,000 and appeared to be building a base for another attempt at the $90,000 psychological threshold.
The US 10-year Treasury yield returned toward 5.3% in Asian trading, maintaining the opportunity cost argument against non-yielding assets like Bitcoin. When government bonds offer a guaranteed return above 5%, the relative appeal of holding a volatile, non-yielding asset diminishes for institutional allocators who must justify their positioning to risk committees. The yield's persistence near this level reflects continued demand for duration and a market that has not fully priced in the possibility of sustained disinflation. For Bitcoin, elevated real yields create a headwind that can offset positive flow dynamics and delay the next leg higher.
Despite the pullback, spot Bitcoin ETF flows remain positive, with net inflows of $102.7 million on October 1 and $189.8 million on October 2. Flow data showed continued institutional accumulation even as price action weakened, suggesting that longer-term buyers are using the dip to add exposure rather than exiting positions. The contrast between positive flows and negative price action creates a divergence that often precedes a stabilization, though it does not guarantee one. Traders will watch whether inflows persist through Wednesday's session as a signal of underlying demand strength.
The weak September payrolls report showed just 29,000 new jobs, with prior months revised down by a combined 60,000. The employment report showed significant cooling in the labor market, reducing expectations for further Fed tightening. Markets now assign less than 20% probability to an October rate hike, a sharp decline from earlier in the week. Weaker employment data is traditionally supportive for risk assets because it reduces the likelihood of additional monetary tightening that would drain liquidity from financial markets.
However, the probability of a December rate hike remains elevated at around 84.5%, keeping the dollar supported. The divergence between near-term and longer-term rate expectations creates a complex backdrop for Bitcoin: the immediate pressure from potential October tightening has eased, but the broader tightening cycle appears far from over. A supported dollar makes dollar-denominated assets like Bitcoin relatively more expensive for international buyers, dampening demand from non-US participants. This dynamic limits the upside potential for risk assets even as shorter-term rate expectations soften.
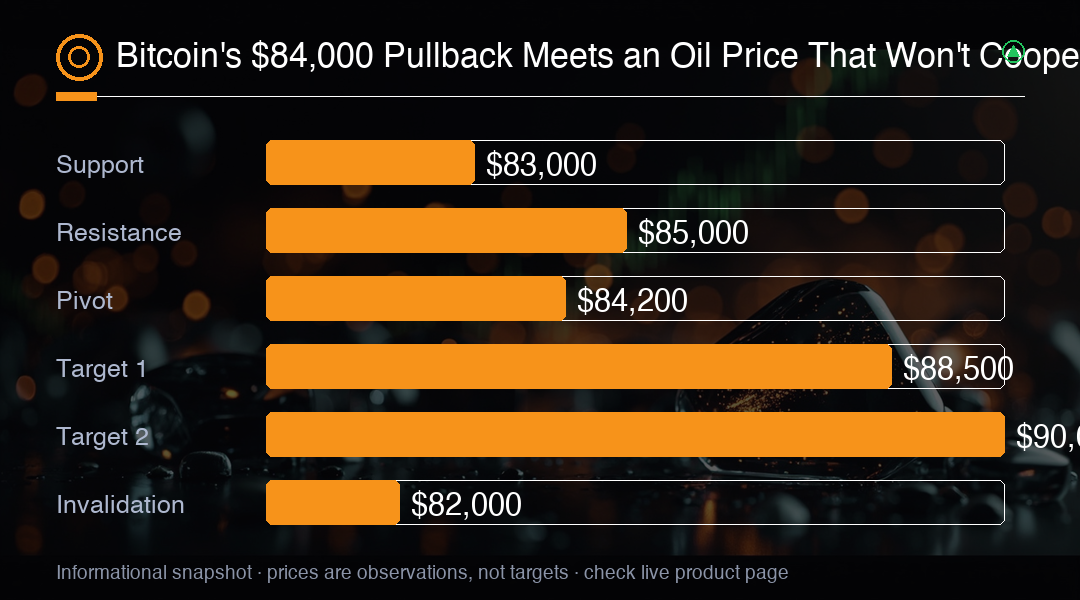
Support levels to watch include $83,000 and $82,000, while resistance above $85,000 could lead to a retest of $87,363 and the $90,000 psychological target. The $85,000 level is the immediate pivot under test, with a sustained break above it likely to attract additional buying from trend-following accounts. Below the market, $83,000 represents the first round-number reference, followed by $82,000 as the deeper support that would need to hold to prevent a more significant decline. A decisive break below $82,000 would invalidate the consolidation structure and open the door to a retest of lower levels.
Trading volume has been declining during the pullback, suggesting reduced conviction among buyers. Lower volume on declines can indicate that sellers are not aggressively distributing, but it also reflects a lack of eager buyers stepping in to absorb offered supply. The combination of falling price and falling volume often precedes a period of consolidation as the market searches for a new equilibrium. Traders typically look for a volume spike on a reversal day to confirm that new demand has entered the market and that the pullback has run its course.
Macro factors remain mixed: weaker employment data is supportive for risk assets, but higher oil prices and yields are headwinds. The net effect of these competing forces is a market that lacks a clear directional catalyst in either direction. Bitcoin's correlation with traditional risk assets has increased during periods of macro uncertainty, meaning that the cryptocurrency is not immune to the same forces that pressure equities and other speculative instruments. Until the macro picture clarifies, either through a decline in oil prices or a more dovish shift in rate expectations, Bitcoin is likely to remain range-bound between $82,000 and $87,000.
Ethereum and other major altcoins are also under pressure, with ETH holding above $2,600. The broader cryptocurrency market tends to move in correlation with Bitcoin, and weakness in the largest asset by market capitalization typically drags down the entire complex. Altcoin underperformance during Bitcoin pullbacks is a common pattern, as traders reduce exposure to higher-beta assets when market conditions deteriorate. The $2,600 level for Ethereum represents a key support that, if broken, could trigger additional selling across the altcoin market and further weigh on overall crypto sentiment.
Traders should watch for a decisive break below $82,000 or above $85,000 for the next directional move. The current range between these two levels has contained price action for several sessions, and a breakout in either direction would likely trigger follow-through from technical traders. A move above $85,000 would target $88,500 as an intermediate objective before the $90,000 psychological threshold, while a break below $82,000 would expose $80,000 as the next major support. Until one of these levels gives way, the path of least resistance appears to be sideways to slightly lower, with the oil-yield pressure providing a persistent headwind that buyers must overcome.
Trading Insight
Bitcoin's pullback from $87,363 faces a critical test at $85,000, with $88,500 as the next intermediate target on a breakout. A sustained break above $85,000 would strengthen the recovery case, while a failure to hold $83,000 would invalidate the consolidation and expose the pair to a retest of $82,000. The oil-yield pressure provides a persistent headwind, but positive ETF flows and a weak payrolls report offer mixed support that could stabilize the market near current levels.