


Bitcoin is testing the $87,363 resistance level as momentum fades, with the cryptocurrency consolidating near recent highs. Bitcoin BTCUSD traded around $87,363 on Monday, attempting to break through a key resistance level that has capped gains in recent sessions. The price action reflects a market that is struggling to find fresh conviction after a strong run, with buyers unable to push decisively above a zone that has repeatedly rejected upward moves. Each attempt to clear $87,363 has been met with selling pressure, and the resulting consolidation has left the market searching for a new catalyst. The $87,363 level has become a critical battleground between bulls and bears, with the outcome likely to determine Bitcoin's trajectory in the coming weeks.
The cryptocurrency has struggled to sustain moves above $87,000, with multiple attempts to breach this level resulting in pullbacks. This price zone has acted as a magnet, drawing in buy orders that are quickly overwhelmed by profit-taking and short-term selling. The repeated failures to hold above $87,000 suggest that the supply of coins available for sale at these levels is significant, and that market participants are unwilling to chase prices higher without clearer confirmation of trend strength. The pattern of lower highs and failed breakouts has created a sense of caution among traders, many of whom are now waiting for a confirmed breakout before committing fresh capital.
Market participants are watching whether Bitcoin can establish a foothold above $87,363, which would open the path toward the psychological $90,000 level. A sustained break above this resistance would likely trigger a wave of short covering and fresh buying from momentum traders who have been waiting for confirmation. The $90,000 level represents a significant psychological barrier, and clearing it would likely attract additional attention from retail investors and institutional allocators who view round numbers as important reference points. Reaching $90,000 would also likely generate positive media coverage, which could bring new participants into the market and create a self-reinforcing cycle of buying.
Technical indicators suggest fading momentum, with the RSI showing signs of divergence and the MACD histogram contracting. The relative strength index has been making lower highs while price has been making equal or slightly higher highs, a classic warning sign that buying pressure is diminishing. The MACD histogram, which measures the distance between the fast and slow moving averages, has been shrinking toward the zero line, indicating that the upward trend is losing steam and that a period of consolidation or correction may be approaching. These technical signals do not necessarily predict an immediate downturn, but they do suggest that the risk-reward balance is becoming less favorable for buyers at current levels.
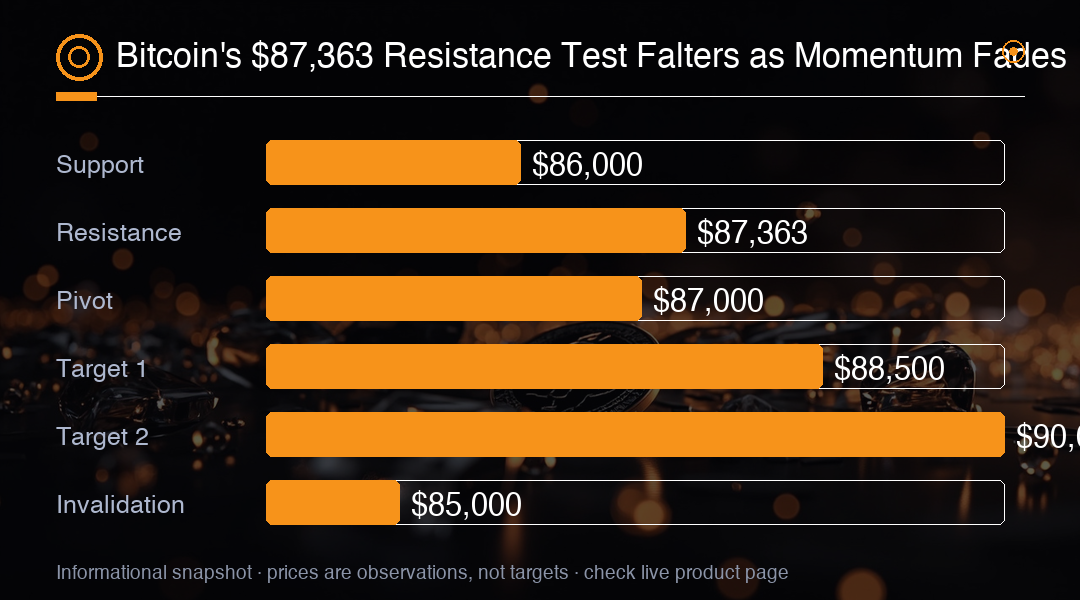
Support levels to watch include $86,000 and $85,000, while resistance above $87,363 could lead to a test of $88,500 and $90,000. The $86,000 level has provided a floor during recent pullbacks, and a break below it would likely bring $85,000 into focus as the next line of defense. On the upside, a confirmed break above $87,363 would likely target $88,500 as an intermediate resistance before the more significant $90,000 psychological barrier comes into play. The $88,500 level represents a measured move target based on the height of the recent consolidation range, and it could act as a stepping stone toward the larger $90,000 objective.
On the downside, a break below $85,000 could trigger a deeper correction toward $83,000 and the $82,000 support zone. Such a move would likely be driven by a combination of stop-loss selling, long liquidation, and a shift in market sentiment from cautious optimism to outright concern. The $83,000 level has historically served as a pivot point, and a sustained break below it would bring the $82,000 zone into focus as a potential area of demand. A decline to $82,000 would represent a roughly 6% correction from current levels, which is within the normal range for Bitcoin but could still shake out weaker hands and create opportunities for longer-term buyers.
Trading volume has been declining during the consolidation phase, suggesting reduced conviction among buyers. Lower volume during price advances is often interpreted as a sign that fewer market participants are willing to commit capital at higher prices, which can precede a reversal or a period of sideways movement. The lack of strong volume support for the recent attempts to break above $87,363 reinforces the view that the market is in a waiting mode, with participants looking for clearer signals before taking on new risk. Volume is a key confirmation tool in technical analysis, and the current decline suggests that the market is not yet ready to make a decisive move in either direction.
Macro factors remain supportive with the recent weak US jobs data reducing Fed hike expectations. The September payrolls report showed just 29,000 jobs added, well below what economists had forecast, and prior months were revised down by a combined 60,000. This combination of weak new hiring and downward revisions has significantly reduced the likelihood of a Federal Reserve rate hike at the next meeting, with market-implied probabilities falling below 20%. For Bitcoin and other risk assets, a less hawkish Fed is generally supportive, as it reduces the opportunity cost of holding non-yielding assets. The weak jobs data also raises the possibility that the Fed may need to cut rates sooner than previously expected, which would be even more bullish for Bitcoin.
The 10-year Treasury yield has retreated from recent highs, providing some relief for risk assets including Bitcoin. Lower real yields reduce the appeal of fixed-income investments and can redirect capital toward alternative stores of value. The correlation between Bitcoin and US yields has been notably inverse in recent months, meaning that when yields fall, Bitcoin tends to benefit from the resulting improvement in risk sentiment. The decline in yields also reduces the pressure on growth stocks and other risk assets, creating a more favorable environment for Bitcoin to attempt a breakout.
Spot Bitcoin ETF flows have been positive, with net inflows of $102.7 million on October 1 and $189.8 million on October 2. These inflows represent continued institutional and retail demand for Bitcoin exposure through regulated investment vehicles. The consistent positive flows suggest that there is underlying demand for the asset even during periods of price consolidation, which can provide a floor beneath the market and limit the depth of pullbacks. The ETF inflows also indicate that institutional investors are using the current consolidation as an accumulation opportunity, which could provide support for a future breakout.
Ethereum and other major altcoins are consolidating alongside Bitcoin, with ETH holding above $2,600. The broader crypto market tends to follow Bitcoin's lead, and the fact that altcoins are holding their ground rather than breaking down is a positive sign for overall market health. Ethereum's ability to maintain support above $2,600 suggests that there is still appetite for risk within the crypto space, even as Bitcoin struggles to break out of its recent range. The relative strength of altcoins during Bitcoin's consolidation could be an early sign that market participants are becoming more confident and are willing to take on risk in smaller, more speculative assets.
Traders should watch for a decisive break above $87,363 or below $85,000 for the next directional move. A close above $87,363 would likely target $88,500 and potentially $90,000, while a break below $85,000 could open the door to a test of $83,000 and $82,000. Until one of these levels is breached, the market is likely to remain range-bound, with traders focusing on short-term opportunities within the established boundaries. The current consolidation phase is a healthy part of the market cycle, allowing the market to digest previous gains and build a foundation for the next major move.
Trading Insight
Bitcoin's $87,363 resistance test is the key near-term catalyst. The weak payrolls data (+29,000, with -60,000 in prior revisions) has crushed October hike odds below 20%, which is fundamentally supportive. However, fading momentum and declining volume suggest the path of least resistance may be sideways until a clear break. Watch for a daily close above $87,363 to target $90,000, or a break below $85,000 to test $82,000.