


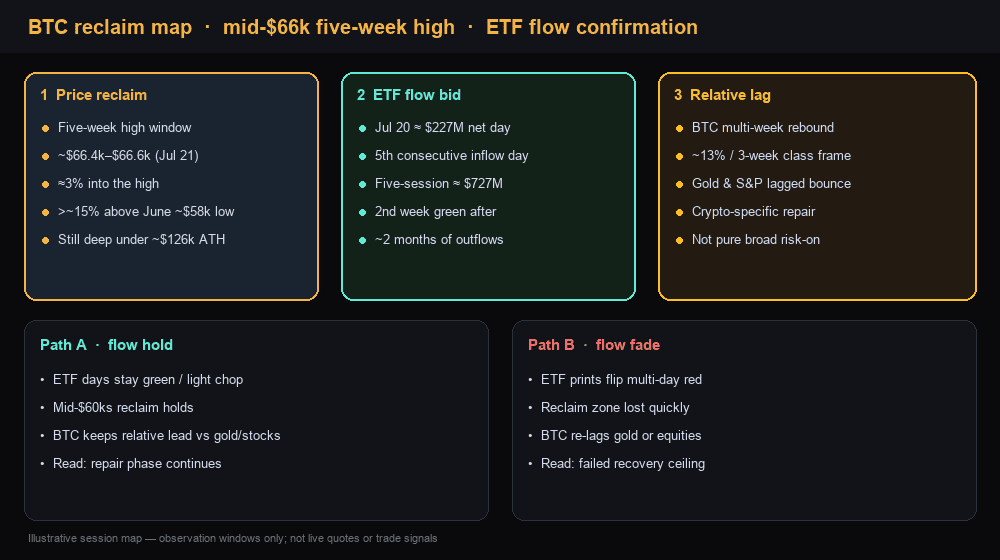
Bitcoin reclaimed a five-week high above the mid-$66,000s as U.S. spot Bitcoin ETFs put together their steadiest multi-day inflow stretch in months. The useful read is not “one green candle equals a new bull market.” It is a three-leg map: the price reclaim, the ETF flow confirmation, and a short window where Bitcoin outpaced gold and equities while cooler inflation optics and steadier Fed sentiment improved risk appetite.
For live core-crypto pricing while that stack is tested, see the BTC product page and the ETH product page.
Key takeaways
- Mid-$66k five-week high is a recovery reclaim from the June trough region — not a cycle all-time high story.
- Multi-day spot ETF inflows (about $227M on July 20; roughly $727M over five sessions) are the capital path that makes the bounce more than a pure short-covering print.
- Watch whether the flow streak holds, the reclaim zone holds, and relative strength vs gold and stocks continues — any leg can fail independently.
Why did Bitcoin print a five-week high?
Bitcoin printed a five-week high because a multi-week rebound from the June lows finally cleared the mid-$60,000s resistance band that had capped the summer recovery. In CoinDesk live-market coverage on Tuesday, July 21, 2026, bitcoin hit about $66,400 for the first time in roughly five weeks, with the 24-hour gain into that high near 3%. Retail and social desks often round the same window as a move “over $66.6K” — same reclaim, slightly different timestamp on a fast tape.
Context matters more than the headline number. The same CoinDesk session notes placed the bounce more than 15% above the June low near $58,000, after a first half of 2026 that left bitcoin deep under its October 2025 cycle high near $126,000. A five-week high is real progress off the floor. It is still a recovery high inside a large drawdown, not proof that the cycle top debate is finished. For a longer structural overlay on how post-peak charts can rhyme without repeating, see Bitcoin’s late-2021 chart rhyme map.
Did Bitcoin ETF inflows actually flip?
Yes in the near-term tape — with an important caveat: a multi-day green streak after two months of bleeding is confirmation of a better bid, not a permanent regime change. CoinDesk, citing SoSoValue, reported that U.S. spot bitcoin ETFs took in about $227 million on July 20, 2026, a fifth consecutive day of net inflows for the first time since late April. The five-session run pulled in roughly $727 million — the steadiest stretch of buying since June’s heavy outflow month. Ether ETFs also printed a smaller positive day in the same window, led by BlackRock’s ETHA on the ether side of the tape.
The weekly frame matches the social complaint that funds had been “losing money for two months.” Bloomberg’s July 20 recap said the 13 spot bitcoin ETFs logged a second consecutive week of net inflows after nearly two months of capital flight — about $75.7 million in the latest week after roughly $197.4 million the week before — even after a large single-day withdrawal earlier in the Iran-risk stretch. Earlier in July, CoinDesk had already flagged a $221.7 million day that ended a painful 10-day outflow streak. Put simply: flows can flip session by session; what changed this week is that the green days finally stacked.
Why traders care: spot ETF creations and redemptions are one of the cleanest real-time reads on whether institutional and brokerage rails are adding or removing bitcoin exposure. Price can spike on leverage and thin books. Sustained creations argue the bid has a slower, more sticky component. That still does not mean every future week will be green — only that the “nobody is buying the product” narrative was outdated by the July 20–21 window. For how regulated product design shapes which tokens can ride those rails, see the SEC crypto ETF 85% rule map.
Why does outperforming gold and stocks matter?
Relative performance tells you whether the bounce is crypto-specific risk appetite or just another day when everything risk-on is green. In the mid-to-late July 2026 window, relative-performance desks and social market notes highlighted a multi-week bitcoin rebound — on the order of roughly 13% over three weeks in one widely shared catch-up frame — while the S&P 500 and gold were described as barely moving by comparison. That is the “closing the gap with traditional markets” language that showed up on Reddit and aggregator wires alongside the $66.6K print.
The trader implication is simple. When bitcoin leads gold, the market is not only bidding a pure safe-haven metal story. When bitcoin leads equities into a reclaim, crypto rails (including the ETF bid) are expressing risk appetite that stocks are not fully matching in the same window. Neither comparison guarantees the next week. Both help answer a desk question: is this a general risk tide, or a crypto-specific repair after months of underperformance?
Macro still cuts both ways. Cooling inflation prints and less hawkish Fed language supported the “steadying policy path” narrative that social desks tied to the rally. At the same time, CoinDesk’s July 21 notes reminded readers that oil and Iran headlines can reprice rate-hike odds higher even while bitcoin is still rising — so “cooler inflation” is a live input, not a permanent green light.
What should traders watch next?
Watch the three legs of the map — flows, the reclaim zone, and relative strength — and update them independently.
Scenario A — flow hold. Spot bitcoin ETF days stay net positive or only lightly choppy, price holds the mid-$60,000s reclaim instead of giving it back in one session, and bitcoin continues to lead or at least not re-lag gold and equities into the next macro print. In that path, the five-week high looks like the start of a repair phase rather than a one-day squeeze. Ether and higher-beta alts usually amplify the same risk regime if the ETF bid stays constructive.
Scenario B — flow fade. ETF prints flip back to multi-day red, the mid-$66k area is lost quickly, and bitcoin underperforms gold or stocks again as oil/rate headlines reassert themselves. In that path, the five-week high was a failed break of a recovery ceiling — useful information, not a moral failure of the bull case. Scenario A fails quickly if creations reverse hard while price loses the reclaim. Scenario B fails quickly if inflows resume and spot reclaims and holds the mid-$66ks with improving breadth rather than a single wick.
Session and flow dashboard
| Lens | Window print | Trader read |
|---|---|---|
| Bitcoin spot | ~$66,400 five-week high (Jul 21, 2026 CoinDesk window); social/radar ~$66.6K language | Recovery reclaim, not ATH |
| Distance from June low | >~15% above ~$58k June trough region (same CoinDesk window) | Bounce has size off the floor |
| Spot BTC ETF day | ~$227M net inflow Jul 20; fifth consecutive day (SoSoValue via CoinDesk) | Primary flow confirmation |
| Five-session ETF run | ~$727M combined | Steadiest stretch since June bleed |
| Weekly ETF regime | Second week of net inflows after ~two-month outflow stretch (~$75.7M + prior ~$197.4M; Bloomberg Jul 20) | Weekly path flipped constructive |
| Relative performance | Multi-week BTC rebound while gold/S&P lagged in catch-up frames (~13% three-week class in social/wire notes) | Crypto-specific repair vs broad risk-on |
| Macro two-way risk | Cooler inflation optics vs oil/Iran rate-repricing risk | Do not treat policy path as fixed |
Figures are observation windows from public market and flow desks — not live quotes. Live pricing: BTC · ETH.
Final thoughts
A five-week high only becomes useful when you know which legs produced it. In this window, the cleaner story is a flow-supported reclaim of the mid-$60,000s while bitcoin briefly led gold and stocks — not a finished verdict on the whole cycle. Keep the three-leg map in view: ETF bid, reclaim zone, relative strength. Update it as the next flow day and the next macro headline land, and treat stacked green ETF sessions as evidence of a better bid rather than a guarantee of what comes next.