


S&P 500 futures fell about 0.4% and Nasdaq futures about 0.7% in Friday Asian trading, extending a retreat that has unsettled global equities. The move followed a sharp US cash-session decline on November 19, when the S&P 500 lost 2.02% to 7,175.83 for its sixth consecutive daily fall. Selling across Asia added to the pressure, while a stronger dollar and weakness in gold and silver pointed to a broad shift in market positioning. The sequence leaves investors assessing whether the latest losses reflect a short burst of risk reduction or a deeper change in sentiment.
The previous session’s losses were widespread across US benchmarks. The Nasdaq Composite fell 2.25%, while the Dow declined 2.19%, putting technology and more traditional blue-chip shares under pressure at the same time. That breadth matters: a decline concentrated in a small group of growth companies can leave the wider market relatively resilient, but synchronized weakness across major indexes signals a more general pullback in risk appetite. Futures remained lower in Asia, suggesting investors were still adjusting to the prior day’s move rather than treating it as an isolated closing-hour selloff.
Technology shares were among the clearest sources of pressure. AMD closed down 7.72% at $489.19 after Hunterbrook Media published a report questioning the company’s China-related exposure. Hunterbrook disclosed that it held a short position, and AMD disputed the allegations. The episode added a company-specific risk to an already weak session for semiconductors. It formed part of the day’s debate around chip valuations and business exposure, while the simultaneous declines in the broader indexes show that the market move extended well beyond one company.
The selloff also overlapped with Anthropic’s first public trading session. The stock closed at $97.17, above its $83 IPO price but below its $111.50 opening trade. That path offered a reminder of how quickly enthusiasm around a high-profile listing can give way to profit-taking after an early surge. Its debut was one event in a crowded market session, alongside steep declines in major indexes and semiconductor shares. The broader retreat therefore had several moving parts, rather than a single company listing accounting for the day’s losses.
In Asia, intraday reporting showed the Nikkei down 4.1%, South Korea’s Kospi lower by about 4.4% and Taiwan’s benchmark off around 5%. These readings came during Friday trading, so they describe the session at the time reported rather than final closes. The MSCI Asia-Pacific index outside Japan was heading for its worst week since March 2020, underlining the scale of the regional retreat. The losses across Japan, South Korea and Taiwan brought the pressure into markets with significant exposure to technology and export-oriented businesses.
The cross-market pattern suggests investors were reducing risk across regions and asset classes. US index futures were lower as Asian shares weakened, while precious metals also fell and the dollar strengthened. That combination can accompany tighter financial conditions or a preference for liquidity, although a single session cannot identify one common motive for every market participant. For equities, the practical consequence is that supportive signals from one region may have less influence when declines are broad and global markets are moving in the same direction.
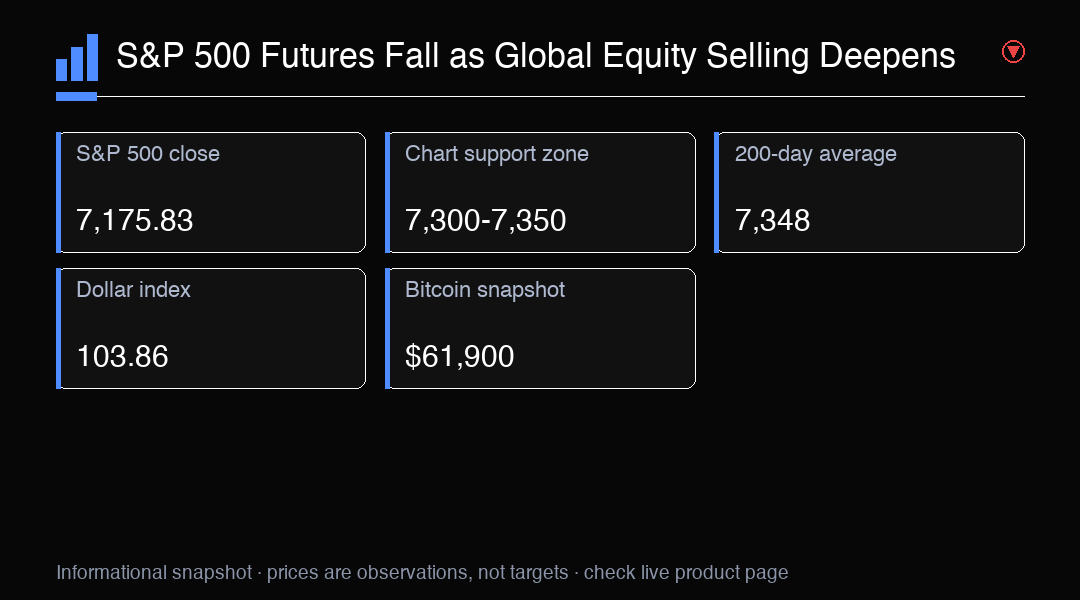
Currency and commodity moves added another layer to the picture. The dollar index traded around 103.86, its strongest level since April 2025. Spot gold was down 1.9% at $3,551.68 at 02:57 GMT, leaving it about 8.9% lower for the week, while silver fell 2% to $41.90. Bitcoin traded near $61,900. These are time-specific market readings, and prices can move materially during active trading. Together they show that the session’s pressure reached beyond listed equities, even as each asset remains driven by its own supply, demand and positioning factors.
For the S&P 500, chart levels have become a focus after the index moved below its 200-day simple moving average near 7,348 and broke a prior uptrend line. The 7,300-7,350 area is a chart-derived reference zone, close to that average, rather than a guaranteed floor. A sustained move back above the area could indicate that buyers are regaining ground, while continued trading below it would keep attention on whether the latest decline is stabilizing. The index’s close at 7,175.83 leaves that zone above the market, making it a reference for monitoring price behavior rather than a prediction.
Momentum readings also reflected the weakening trend. The relative strength index was near 31 and the moving average convergence divergence indicator remained bearish. An RSI near that level can signal that selling has been intense, but it cannot by itself establish that a reversal is imminent. In a persistent decline, momentum may remain weak while prices continue to fall. Traders may therefore watch how the index behaves around the chart reference zone and whether successive sessions bring narrower losses, rather than relying on one indicator as a standalone signal.
The next phase depends on how investors respond to the combination of index losses, technology weakness and global participation. A pause in selling could help prices consolidate after the rapid retreat, especially if large technology shares stop setting the direction for the broader market. Further declines across Asian benchmarks, continued weakness in US futures or renewed pressure in semiconductors would keep attention on downside momentum. Company-specific developments, currency moves and shifts in precious metals can also alter the tone, so the relationship between these markets may change as new information arrives.
For traders following the broad S&P 500 through US500, the key question is whether price action can stabilize after the sixth consecutive decline. The 7,300-7,350 zone and 7,348 average offer nearby chart references above the latest close, while the 7,175.83 close records the level reached in the November 19 cash session. Those figures help frame the market’s position; they do not define future support or resistance with certainty. The dollar’s strength, global equity participation and semiconductor performance provide context for interpreting any stabilization or renewed selling.
Trading Insight
S&P 500 closed at 7,175.83, below its 200-day average near 7,348. Monitor how price responds around the chart-derived 7,300-7,350 zone alongside global equity breadth and semiconductor performance.