


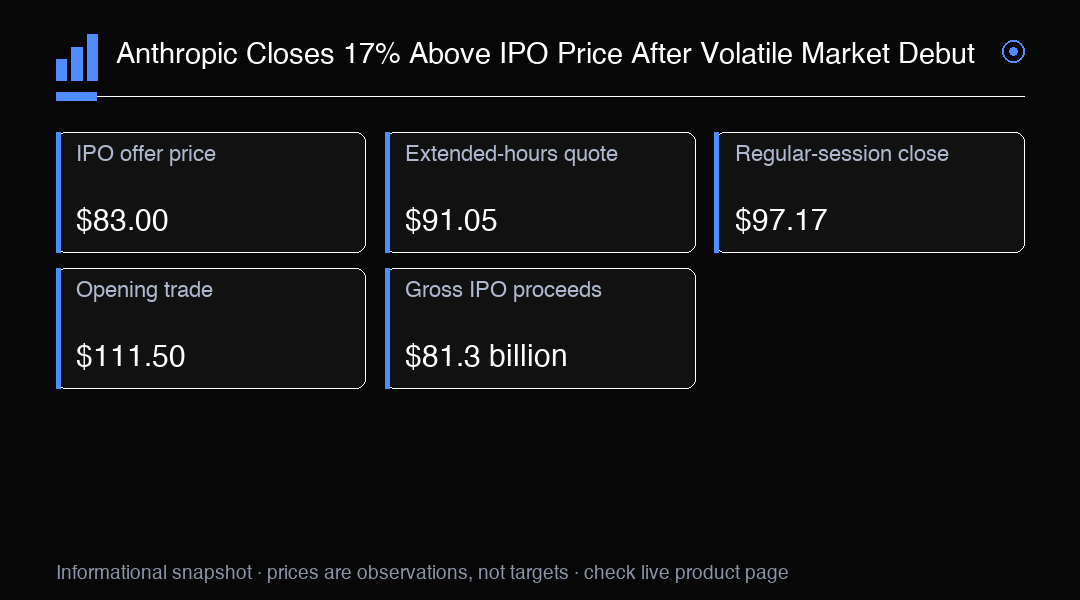
Anthropic’s Nasdaq debut sent two sharply different signals about demand. Shares began trading on November 19 at $111.50, 34% above the $83 offer price set the previous day, then closed the regular session at $97.17. That left ANT 17.07% above its IPO price and 12.85% below its first trade. The gain rewards comparison with the allocation price; the decline describes the path faced by buyers who entered once public trading began. Both readings matter because the debut was defined by a steep opening premium followed by a meaningful retreat. The offer-to-close gain therefore says little about entry conditions after the opening auction.
The first trade arrived shortly before noon ET, after the offering had priced at $83 on November 18. That gap made the opening print an immediate test of how much buyers would pay once shares were available on Nasdaq. Strong early demand met a limited supply of shares in the initial market, and the first price quickly became a high bar for the session. ANT then gave back $14.33 by the close. The move from the opening trade shows price discovery continuing after the first transaction, as buyers and sellers adjusted expectations through the regular session. Early prints may therefore adjust quickly as more participants meet.
Investors therefore need to keep three reference points separate. The $83 offer price represents the public deal’s sale level; $111.50 marks the first public trade; and $97.17 records the regular-session close. The percentage return changes with the benchmark: 17.07% from the offer, versus a 12.85% decline from the open. Neither comparison describes every investor’s experience, since access to the IPO allocation and timing of a public-market purchase differ. Using the full sequence gives a more useful reading of the debut than a single headline return. Comparisons are most useful when price, timestamp and session travel together.
The financing scale added another layer to the opening repricing. Anthropic sold 980 million shares at $83, generating $81.3 billion in gross public IPO proceeds. A separate $26 billion private placement brought the reported total transaction size to $107.3 billion. The proceeds measure capital raised through the transactions; later changes in ANT’s share price affect the market’s valuation of equity. Keeping those measures distinct prevents deal size from being mistaken for a daily gain, loss or cash flow from trading. This separates funding raised from valuation changes in secondary trading.
Valuation estimates moved markedly with the share price. At the offer, Anthropic was valued at about $1.5 trillion on a fully diluted basis and about $1.1 trillion on a non-diluted basis. The $111.50 first trade implied a fully diluted value near $2 trillion, while the $97.17 close implied approximately $1.76 trillion. The gap between fully diluted and non-diluted estimates reflects whether potential future shares enter the calculation. That distinction matters when comparing headline valuations, while the intraday change shows how quickly market pricing can alter the implied value attached to the same company. The lower implied value at the close followed from the lower share price, rather than a separate transaction.
The opening premium also changes how investors might interpret follow-through. If the market continues to trade below $111.50, that level remains a reference for buyers who entered at the first print and for sellers assessing a return to the opening price. A move back toward it would indicate that demand had absorbed the initial retreat; a failure to regain it would leave the opening premium unrecovered. These are conditional ways to read price action, not forecasts. The offer price and regular close provide separate reference points for judging whether later trading stabilizes above the deal level. A plan built around one level alone would miss that shift in reference.
Extended-hours trading added evidence of near-term pressure. A reported quote at 8:57 p.m. ET put ANT at $91.05, down 6.3% from the regular-session finish. Because this was a time-stamped after-hours observation, it describes trading interest at that moment rather than a closing price or a Friday opening quote. Liquidity can be thinner and spreads wider outside regular hours, making individual prints less representative of broad participation. The quote extends the day’s price-discovery story, while the regular-session close remains the clearest benchmark for comparing the debut with standard market trading. An after-hours quote can extend a move without confirming where regular-session liquidity will settle.
The listing arrived during a broad equity selloff. The Nasdaq Composite fell 2.25% to 23,879.20, the S&P 500 lost 2.02% to 7,175.83 and the Dow dropped 2.19% to 49,097.06. Concerns around AI spending, valuations, borrowing costs and geopolitical uncertainty formed part of the market backdrop. Such conditions can influence appetite for growth-oriented assets and newly listed companies, but the index declines alone cannot explain ANT’s intraday path. For investors, the useful transmission channel is risk appetite: a weaker broad market may make buyers more selective while company-specific price discovery is still developing. This backdrop can shape the discount investors demand for uncertain growth as listing-specific flows influence ANT.
That setting makes relative performance informative but incomplete. ANT finished above its offer price while the major US indexes fell, yet it also closed well below its first trade. The mix points to support relative to the deal price alongside a sharp reassessment from the opening level. Index moves provide context for the session’s risk environment, while ANT’s own trading range reflects demand and supply in the newly listed shares. Neither should be substituted for the other when assessing the stock: broad-market weakness and company-specific repricing can operate at the same time. This avoids assigning ANT’s weakness entirely to index conditions or treating relative strength as immunity.
For traders, the practical task is to track price against the correct reference and session. The $83 offer price frames the deal; $111.50 captures the initial public-market premium; $97.17 marks the regular close; and $91.05 records the later extended-hours quote. The sequence can help distinguish stabilization from continued repricing as subsequent trading unfolds. Valuation estimates should be read with the same discipline: fully diluted and non-diluted figures answer different questions, and an implied valuation changes with the share price. This framework keeps return, transaction proceeds and equity value from being conflated. Watching closes across sessions can reduce the weight placed on isolated moves.
NAS100 can provide broad Nasdaq context as investors monitor technology-heavy index conditions alongside ANT. It offers no direct Anthropic exposure and no hedge against company-specific price moves, so the stock’s own trading remains central to assessing its debut. The key question is whether later price discovery consolidates around the regular-session close, revisits the offer level, or works back toward the first trade. Each path would show a different balance between the strong IPO demand indicated by the offer comparison and the selling pressure visible after the opening surge. This ties technical levels to actual deal and trading references.
Trading Insight
ANT’s 17.07% gain from its IPO price masked a 12.85% decline from its first trade. Track each comparison with its reference price and session; NAS100 offers broad Nasdaq context, not direct ANT exposure or a hedge.