


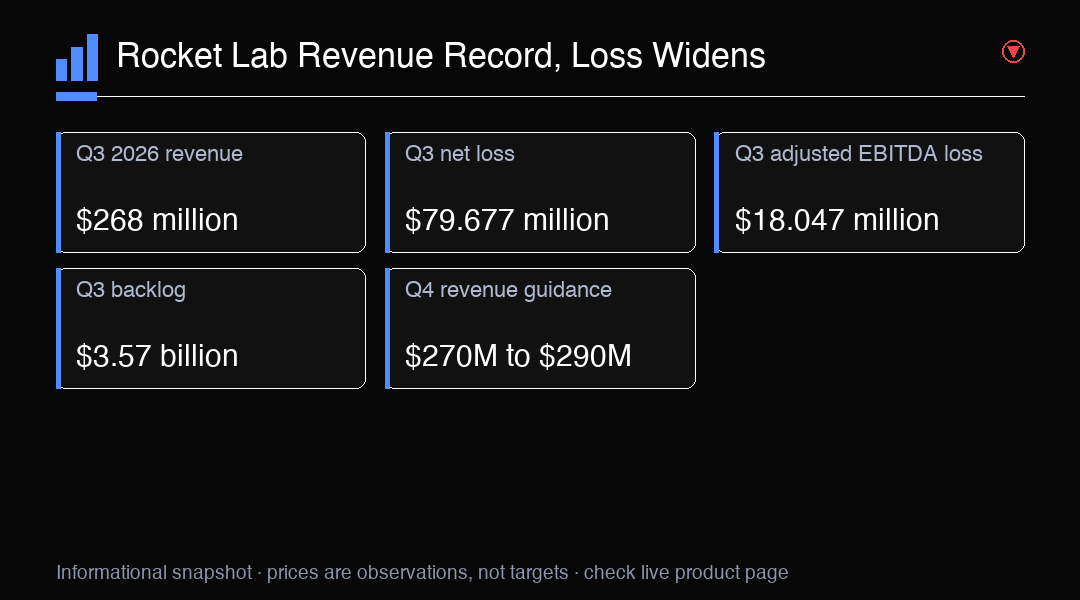
Rocket Lab’s third-quarter results put two different parts of its growth story in focus. Revenue reached a record $268 million, up 73% from a year earlier, while the GAAP net loss widened to $79.677 million from $18.257 million. The company also reported an adjusted EBITDA loss of $18.047 million. Together, these figures show rapid expansion alongside substantial accounting and operating losses. They do not, by themselves, establish how quickly the business can convert demand into durable profitability. The revenue figure measures sales recognized during the quarter, while the losses measure different aspects of the costs and expenses associated with the business. Reading them together gives a fuller view of the period than relying on the growth rate alone. It also keeps the distinction between current scale and the economics of sustaining that scale in view.
The stock’s price action also needs to be read in separate time windows. Rocket Lab shares rose 10.9% during Monday’s regular session, then fell roughly 5% in after-hours trading following the results. The first move reflects trading during the regular market session; the later move occurred after the earnings release. Combining them into a single daily direction would obscure that sequence. The after-hours decline indicates a negative initial reaction, but it does not establish what investors will conclude after further analysis or how the next regular session will trade. Regular-session prices and after-hours prices form distinct observations, each reflecting trading at a different point in time. The sequence is useful context for the earnings release, but it cannot explain every participant’s reasoning or settle the market’s later assessment of the results.
Revenue growth is a clear measure of business scale, but its durability depends on more than the headline percentage. A 73% year-over-year increase compares this quarter with the same period last year. It does not show whether the pace will continue, whether each business line contributes evenly, or how much revenue translates into gross profit and cash. Those questions matter for a company investing in launch services, spacecraft systems and new vehicle development. The reported result is a strong growth figure; the next analytical step is to track its composition and related costs over time. A single comparison identifies the change between two periods, while a sequence of reports can show whether expansion is broad, sustained or affected by the timing of individual activities. The figure alone does not answer those questions, so revenue growth is best considered alongside profitability and cash measures.
The wider GAAP net loss deserves attention alongside that growth. Net loss increased to $79.677 million from $18.257 million, a sizeable change from the prior-year quarter. GAAP earnings include accounting items that can differ from measures used to assess operating performance, so investors may compare the reported loss with adjusted measures. That comparison does not make the GAAP result irrelevant. It helps identify which parts of the earnings picture are recurring, which are noncash or otherwise adjusted, and whether the underlying cost base is changing in step with revenue. The reported net loss remains an important measure of the quarter under accounting rules. An adjusted figure can provide another view, but it depends on the items excluded and does not replace the reported result. Both measures need to be understood on their own terms before drawing conclusions about the direction of the company’s economics.
Adjusted EBITDA loss was $18.047 million, while GAAP operating cash flow was positive $7.2 million. These measures answer different questions. Adjusted EBITDA focuses on a company-defined view of earnings before specified items, interest, taxes, depreciation and amortization. Operating cash flow records cash generated or used by core operations under accounting rules. Positive operating cash flow in the quarter is constructive evidence about cash movement, but one quarter does not prove that cash generation will persist. A careful read keeps the positive cash-flow figure in view without treating it as a substitute for the net loss. Nor should the adjusted EBITDA loss be read as a direct statement about cash collected or paid during the period. The measures describe separate parts of the financial picture, and their movement across future reporting periods would provide additional evidence about consistency and operating performance.
Backlog reached $3.57 billion, up 52% sequentially, and the company listed 117 launches in its total launch backlog. These figures describe contracted or scheduled work recorded at a point in time. They can give investors a view into potential future activity, but backlog is not the same as revenue already earned, cash already received or launches completed. Timing, customer requirements, production capacity and execution can affect when and how work becomes revenue. The sequential increase is notable, while conversion into delivered work remains the practical measure to watch. A backlog figure therefore captures the amount of work represented in the reported total at that moment, not a promise that every item will be completed on a particular date. The launch count adds a measure of scheduled activity, but it also remains separate from the number of launches actually carried out. Changes in backlog and completed work can be compared as later results become available.
Neutron adds a longer-term development and execution question to that backlog picture. Rocket Lab said Neutron launch contracts exceeded $515 million and its backlog reached 16 missions before the vehicle’s debut. The first launch remains targeted for no earlier than 2027, so the schedule is forward-looking rather than a completed milestone. A mission count and contract value indicate commercial interest, but they do not settle technical readiness, timing or eventual delivery. Investors can track progress against disclosed milestones while keeping the distinction between contracted missions and completed launches clear. The stated timing also places Neutron within a longer horizon than the reported third-quarter financial results. Contracted work can inform expectations about potential future activity, while development and launch milestones provide separate evidence about progress. Neither the contract total nor the mission count demonstrates that the vehicle has already flown or that its planned timing is assured.
Fourth-quarter guidance calls for revenue of $270 million to $290 million and an adjusted EBITDA loss of $14 million to $20 million. Guidance provides management’s stated range for the coming quarter, not a guaranteed outcome. The revenue range is above the third-quarter result in nominal terms, but a comparison between quarters alone cannot account for timing, business mix or other operating factors. The adjusted EBITDA loss range also points to continued losses under that measure. Future results can land within or outside guidance as execution and conditions develop. The range is useful because it frames the company’s stated expectations across both revenue and adjusted EBITDA, but it does not provide a confirmed result for the quarter. The loss guidance should be read using the same measure as the reported adjusted EBITDA figure, with the exclusions inherent to that measure kept in mind. Actual reported results will show how the quarter compares with the stated ranges.
This mix of record sales, larger net loss, positive operating cash flow and expanding backlog leaves several useful questions for subsequent reports. Does revenue growth continue across periods? Does cash generation recur? How does the net loss evolve as the company grows? What portion of backlog converts into completed launches and recognized revenue, and how does Neutron progress toward its stated schedule? These questions do not require a prediction about the next share-price move. They provide a framework for separating reported operating evidence from expectations about future execution. Looking at the questions together helps avoid treating sales growth as proof of improving profitability, or backlog as proof of completed work. Each measure can develop differently, and later results can clarify whether changes in one area are accompanied by changes in the others. This framework keeps attention on disclosed performance and progress rather than assuming an outcome from any single figure.
For market context, Rocket Lab’s results concern an individual aerospace company, while NAS100 is a broad index proxy. NAS100 does not provide direct exposure to RKLB, and its performance can reflect many companies and market-wide forces that differ from Rocket Lab’s business. Traders examining the broader index can use its movement as general market context, but should not interpret it as a direct expression of Rocket Lab’s company-specific earnings, backlog or launch program. The index and the company therefore represent different kinds of market information. Company results describe Rocket Lab’s reported business measures, while index movement reflects a broader grouping. Keeping those scopes distinct matters when discussing how the earnings release relates to wider market conditions. Shared market context does not make the index a direct measure of the company’s revenue, losses, cash flow or future launch activity.
Rocket Lab’s quarter therefore combines strong reported expansion with continuing losses and significant delivery requirements. Revenue and backlog show scale and demand indicators; cash flow offers a separate quarterly snapshot; and guidance and Neutron targets describe plans that remain subject to execution. Keeping those measures distinct helps avoid treating any single headline as a complete account of the business. Further results can clarify whether growth is accompanied by improving economics and whether scheduled work progresses into completed activity. Until then, the figures are best read as evidence of momentum and ongoing execution risk, with no assured outcome for the stock or the wider market. The results present multiple strands of evidence rather than a single conclusion: record revenue describes the quarter’s sales, the losses describe continued negative earnings measures, operating cash flow captures a separate cash result, and backlog records potential future work. Guidance and the Neutron schedule add forward-looking context, but neither changes the status of those plans into completed results.
Trading Insight
Separate revenue growth, accounting losses, operating cash flow and backlog conversion when assessing Rocket Lab. NAS100 is a broad market proxy and does not provide direct RKLB exposure.