


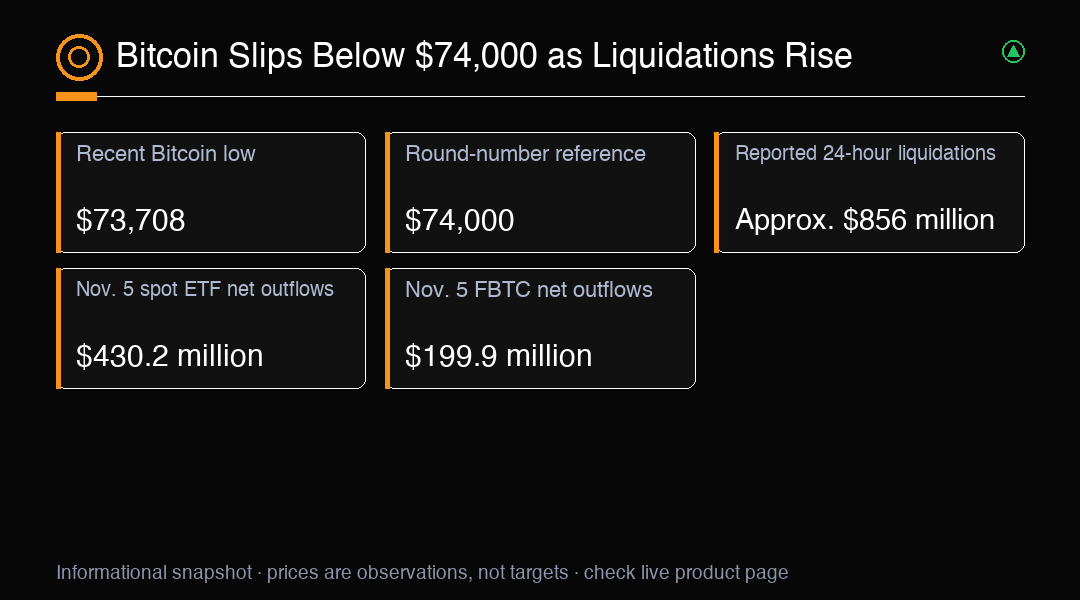
Bitcoin fell below $74,000 in late Sunday and early Monday trading, reaching $73,708 and its lowest level since August. This was a continuous crypto market quote, not a US equity session close. Ether also weakened, falling about 5% to $2,223, its lowest level in more than two months. The declines show selling pressure extended beyond Bitcoin, though two large assets alone cannot describe every token or trading venue. For market participants, the immediate picture is a sharp retreat across major cryptocurrencies. The size and persistence of that move remain dependent on how prices develop across venues and time periods.
A move through a round number can attract attention because traders may use prominent levels to organize orders, track price action, or set risk limits. That attention does not make $74,000 a guaranteed floor or ceiling. Prices can move through such figures when available bids and offers shift, and quotes may differ slightly between platforms. The $73,708 low is a specific observation from late Sunday to early Monday, not proof that the same price will hold as support. It is more useful as a reference for comparing subsequent trading than as a standalone signal. The distinction matters when a widely watched number starts to influence decisions.
A reported estimate put crypto liquidations over a 24-hour period around the weekend selloff at approximately $856 million. Liquidation is a forced position closure: a trading venue closes a leveraged position when its remaining collateral no longer covers losses under that venue's rules. These closures can add market orders during an already fast move and increase short-term volatility. The figure is approximate and attributed in secondary coverage to CoinGlass, rather than representing an exchange-audited total across the entire market. Coverage, timing, venue participation, and calculation methods can differ. Treat the number as an indicator of reported activity, not a complete accounting of every forced closure.
Liquidations also need careful interpretation. A high total can be consistent with crowded or highly leveraged positioning, but it cannot by itself establish what started a decline or how much forced closures contributed to the price change. Price weakness can trigger liquidations, and liquidation orders can in turn add to market movement. This feedback loop is plausible during volatile periods, but the estimate does not measure each link in that chain. It does not show whether positions were net long or short across all venues, how much risk traders reduced before forced closure, or whether they reopened positions elsewhere. Those gaps make the figure useful context, but a weak basis for a causal conclusion.
Fund flows offer another piece of context. US spot Bitcoin exchange-traded funds recorded $430.2 million in net outflows on Thursday, Nov. 5, 2026. Fidelity's FBTC accounted for $199.9 million of net outflows, while BlackRock's IBIT recorded $105 million. Those figures describe fund activity on that date, several days before the late Sunday and early Monday price low. They can inform a view of recent investor demand for these products, but one day's withdrawals do not establish the behavior of all Bitcoin holders or explain a later market move on their own. Their timing should remain clear when comparing them with subsequent prices.
Flow data has limits that matter in a fast market. Net outflows measure activity in the covered funds, not a direct count of every investor's conviction or every spot purchase and sale. Fund flows can respond to price changes as well as broader portfolio decisions, and reported totals may be revised or vary by methodology. The timing also matters: Thursday's figures are a prior observation, not a live measure of demand during the weekend decline. Comparing several sessions, alongside prices and liquidity conditions, can provide a fuller picture than treating one daily total as a verdict. A short sequence of readings may also look different from the broader trend.
Political developments may shape expectations about future crypto oversight, but an election result does not immediately rewrite the rules that apply to exchanges, tokens, or investment products. Investors may reassess the possibility of policy changes, timelines, or enforcement priorities as new information emerges. Those expectations remain uncertain until specific measures are proposed, adopted, or otherwise become operative. The distinction is useful: policy uncertainty can influence how participants assess risk, while an election outcome alone does not establish that an immediate regulatory change occurred or drove the price decline. Actual rules and implementation details matter more than assumptions about what future policymakers might do.
Several paths remain possible after a move of this size. Bitcoin could stabilize as forced positions are reduced and buyers and sellers find balance. It could continue to fluctuate if leverage and liquidity remain uneven. It could also recover some ground if demand improves. These are scenarios, not predictions, and none follows automatically from the liquidation estimate or a single day of fund flows. Ether's decline adds evidence of weakness in another major asset, but does not prove every cryptocurrency will move in the same direction. Conditions can diverge across assets and venues, and market liquidity can change quickly as participants adjust exposure.
The way a trader interprets the move depends partly on timeframe. A short-term participant may focus on rapid price changes, venue liquidity, and the conditions that could trigger a margin call. A longer-term investor may weigh portfolio exposure, investment horizon, and tolerance for volatility. Neither perspective removes risk. Leverage can magnify gains and losses, while liquidation rules, funding costs, and venue-specific margin requirements can affect outcomes even when underlying prices are similar. Understanding those mechanics before taking a position can help avoid relying on a single level or market statistic when conditions change.
Risk management starts with matching position size to the possibility of rapid price changes. Participants can review their exposure, understand what may trigger forced closure, and consider how losses could affect their broader portfolio. An order or margin setting cannot guarantee execution at an intended price during a fast market. Longer-term investors may instead compare their time horizon and portfolio limits with the volatility they are prepared to tolerate. These approaches serve different needs, but both benefit from clear assumptions and regular review. No price reference, flow figure, or risk control guarantees a particular outcome.
Useful indicators to monitor include Bitcoin's trading around the recent low and the $74,000 reference, Ether's behavior near its reported level, updated liquidation estimates, and subsequent daily ETF flow readings. Check each figure with its timestamp and methodology in mind. The BTCUSDC pair provides a trading interface tied to Bitcoin's price against a US dollar stablecoin, but it is a venue-specific market proxy. Its quote may differ from other spot markets, and the pair carries platform, liquidity, and stablecoin-related risks. A measured assessment keeps those limitations visible and treats new data as context rather than certainty.
Trading Insight
The liquidation estimate and Thursday fund outflows describe different windows and different market activity. Compare their timing with price behavior across venues, and treat the recent low and $74,000 as reference points rather than guaranteed levels.