


Michael Burry's 1987-type crash warning is not confirmed by the market yet. The S&P 500 reached a record close on August 4, 2026, and slipped only 0.2% the next day. His call is better treated as a risk hypothesis: watch whether trend, breadth, volatility and liquidity begin to deteriorate together.
That distinction matters for both index and crypto traders. A famous bearish view can arrive months before the tape turns—or fail while prices keep climbing. The market, not the headline, supplies the timing.
Key takeaways
- Burry warned of a possible major top, not a dated crash forecast.
- Black Monday was a one-day liquidity event on a scale modern circuit breakers are designed to interrupt.
- Confirmation needs several signals to weaken together, not one red session.
What did Michael Burry actually say?
Burry said a major top and a 1987-type fall were possible even as fresh highs could attract more money. CNBC reported the remarks from his Tuesday Substack post as the S&P 500 rallied 1.9% to its first record close since June.
The wording matters. “Possible” describes tail risk; it does not set a deadline or prove that the top is already in. The same comment also acknowledged the reflexive strength of a breakout: new highs can pull sidelined capital into the market and extend the rally before any reversal.
Burry's reputation comes from his subprime-mortgage trade before the global financial crisis, but reputation cannot replace current evidence. A trader still needs to define what would confirm the bearish case—and what would invalidate it.
What would a “1987-type” fall mean?
It would mean an unusually fast market break amplified by shrinking liquidity and feedback loops, not simply a normal correction. Federal Reserve research says the S&P 500 fell about 20% on October 19, 1987. Federal Reserve History records a 22.6% one-day fall in the Dow Jones Industrial Average, still its largest single-session percentage decline.
The 1987 crash was severe because selling pressure and market structure interacted. Portfolio-insurance strategies sold more futures as prices fell, cash and futures markets became dislocated, and the ability of intermediaries to provide liquidity came under strain. The result was not just lower prices; it was impaired market functioning.
Today's structure is different. The New York Stock Exchange's 2026 rules pause US equity trading after S&P 500 declines of 7% and 13% before 3:25 p.m. ET, and stop trading for the rest of the day at 20%. Circuit breakers do not remove overnight gaps or guarantee orderly prices, but they make a literal replay of 1987's uninterrupted session less comparable.
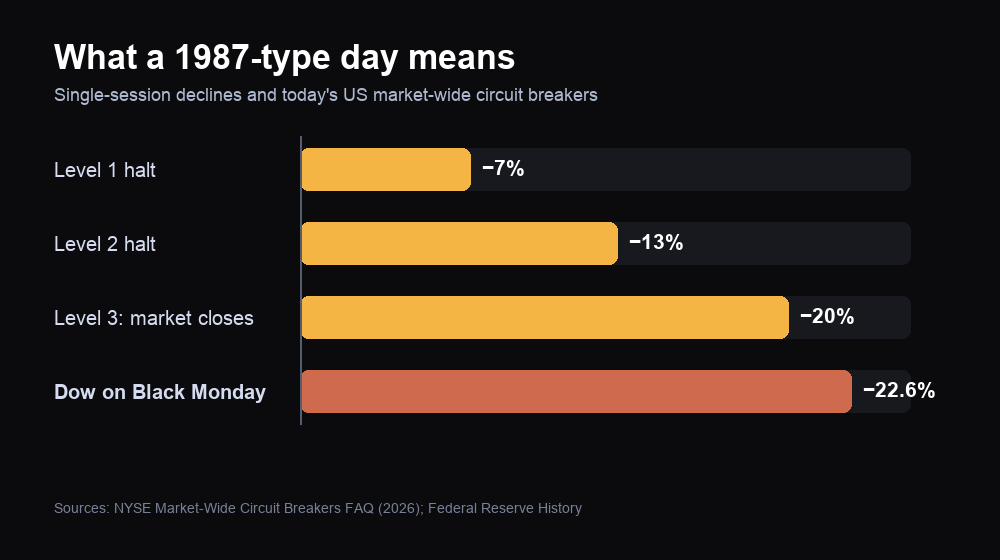
The circuit breakers use S&P 500 declines; the historical 22.6% bar is the Dow's October 19, 1987 move. It shows scale, not an index-for-index forecast.
Does the current market confirm Burry's warning?
No: the latest price action shows a market near records, with early divergence but no broad breakdown. The Associated Press reported that the S&P 500 closed August 5 at 7,723.55, down 0.2% after setting a record the day before. The Dow rose 0.5% to another record at 54,349.12, while the Nasdaq Composite fell 0.8% to 26,363.44.
That split is worth watching because technology weakness can narrow an index rally. It is not enough to label a major top. One session of Nasdaq underperformance can be profit-taking; a more serious signal would be repeated failure by the broad market to confirm new highs, followed by lower highs and lower lows across several benchmarks.
The cleanest read is therefore neutral on timing. Burry's valuation and concentration concerns may identify fragility, while the tape still shows buyers willing to defend the broader uptrend. For the opposite forecast framework, see the MC Markets analysis of the S&P 500 above-8,000 case.
Which signals would turn the warning into confirmation?
Require agreement across four areas: trend, breadth, volatility and liquidity. No single indicator predicts a crash. The value comes from convergence—especially when deterioration persists after an initial selloff.
| Signal | Warning only | Stronger confirmation | Bear case weakens if… |
|---|---|---|---|
| Price trend | One reversal from a record | Lower highs and broad breaks of medium-term trend | Indices reclaim highs and hold them |
| Market breadth | Nasdaq lags for a session | Fewer stocks and sectors participate across repeated rallies | Equal-weight and cyclical groups confirm |
| Volatility | VIX rises briefly | Implied volatility stays elevated as equities fail to rebound | Volatility fades while price stabilizes |
| Liquidity | Wider spreads around a headline | Persistent gaps, weak depth and correlated forced selling | Dip buying restores orderly two-way trade |
Cboe defines the VIX as the options-implied estimate of S&P 500 volatility over the next 30 days. That makes it a forward-looking stress gauge, but not a directional guarantee. A VIX spike that quickly reverses says something different from volatility staying high while index rebounds repeatedly fail.
Trend should carry the greatest weight. Valuation can remain elevated for a long time; price structure reveals when investors have begun to act on those concerns. For another example of concentration changing the index signal, see the MC Markets review of the Nasdaq chip selloff and AI valuations.
How should crypto and global traders read the spillover?
Watch whether weakness becomes a cross-asset liquidity event rather than assuming crypto must follow equities point for point. Bitcoin and major crypto assets often trade as high-beta risk exposure during forced deleveraging, but they can diverge when crypto-specific flows dominate.
A broader stress regime would normally show up through several channels: US index futures weakening together, volatility remaining firm, the dollar or funding conditions tightening, and leveraged assets failing to rebound. If only mega-cap technology falls while the Dow, credit and crypto remain orderly, the evidence points more toward rotation than a 1987-style cascade.
Overnight gaps deserve special attention. Modern US circuit breakers apply during the cash session, while futures and global markets keep transmitting new information across time zones. The first move can therefore appear in Asia, Europe, US500 futures or crypto before New York cash trading opens.
Final thoughts
Burry's warning is useful because it forces traders to consider a low-probability, high-impact path while confidence is high. It becomes dangerous only when treated as a calendar. A record-high market can stay expensive; a fragile market can repair itself; and a genuine break should leave evidence across more than one indicator.
Keep the call on the dashboard, then let trend, breadth, volatility and liquidity decide how much weight it deserves. If those signals do not confirm, the warning remains a warning.