

Crypto timelines are full of the same screenshot: Bitcoin’s chart looks exactly like late 2021 — double top, bear flag, breakdown. The useful map is not “fractal equals forecast.” It is overlay versus floor: the shape rhyme can be real while the stack under price is not a 2022-style empty pocket. For live core pricing while that debate runs, see the BTC product page and the ETH product page.
Key takeaways
- Late-2021 overlay language (double top, flag, breakdown) is a fair shape rhyme — not proof of a full 2022 replay.
- 2022’s deep crash had thin structural demand under the old high; mid-2026 spot sits near a denser $60K–$65K shelf and long-average zone.
- Watch two paths: floor holds through the “waiting” phase, or weekly structure fails under the shelf and the overlay fear gets a second vote.
Why does Bitcoin look like late 2021 right now?
Because the chart vocabulary is the same: twin highs, a consolidating flag, and a breakdown scare — and retail eyes are trained to finish that movie with 2022. On July 20, 2026, widely shared X chart posts framed Bitcoin as a late-2021 clone: double top, bear flag, breakdown, with the overlay described as “real.” Parallel threads argued the hard part of every cycle is not the crash but the waiting — every bounce sold, price still wrestling long moving averages — while cycle-calendar posts claimed the next “bloodbath” was already dated even as others argued about the next all-time high.
That package travels because it answers a real fear after the October 2025 peak. Pattern matching is a legitimate starting prompt. It becomes a bad map when shape rhyme is treated as destiny without asking what demand, leverage, and structural floors sit under the same silhouette.
What did the 2021–22 path actually look like?
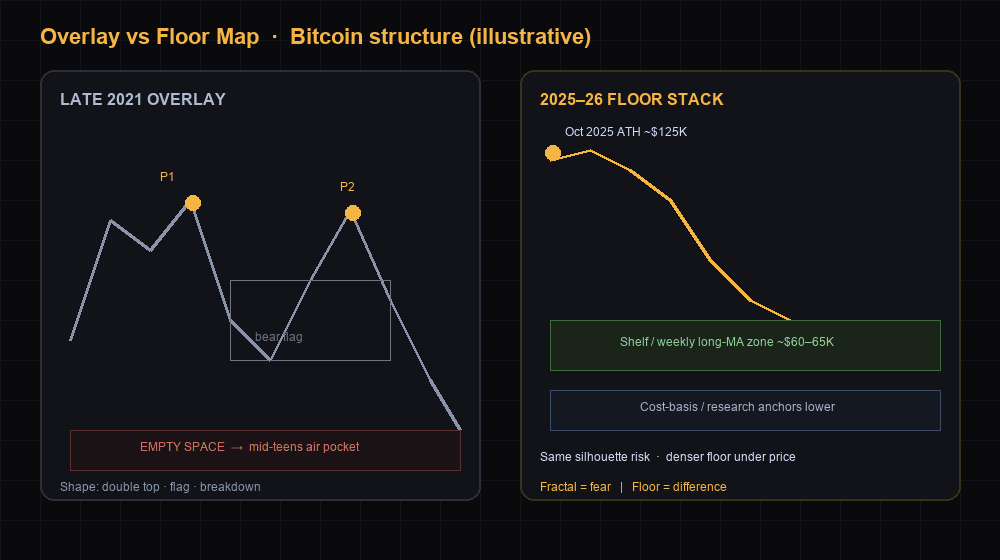
2021 printed a classic twin-peak drama; 2022 then found a long air pocket lower. Pattern guides that restate the 2021 weekly structure usually cite a spring peak near about $64,800 and a second peak in November near about $69,000 before the multi-month collapse. The path into the 2022 low was not a single tidy technical event: leverage unwind, the Terra/LUNA failure, the FTX collapse, and a global rates shock stacked into one of the deepest modern drawdowns — with spot eventually probing the mid-teens near $15,000–$16,000.
In social language that is the “empty space” problem: once prior-cycle support failed, there was little dense institutional shelf to catch the tape for months. The fractal fear from today’s overlays is really a memory of that air pocket — not proof that every double-top silhouette must replay the same dollar path.
What is different under the market this time?
The peak was higher, the drawdown so far is still a mid-cycle cut rather than a finished winter, and the cost basis / long-average stack sits much closer to price than in 2022’s free-fall zone. Galaxy Research’s June 12, 2026 cycle note pins this cycle’s all-time high daily close at $124,824 on October 6, 2025 (with contemporaneous session coverage of peaks near the $126,000 area on the same top day). Into the July 20–21, 2026 window, Yahoo Finance and CoinDesk price prints clustered Bitcoin roughly in the $65,000–$65,500 band — on the order of a ~48–50% fall from that October high depending on the exact print, still far above a classic 75–85% cycle washout.
Floor language on the tape is concrete. Social structure posts on the same July 20 window put the weekly 200 EMA near about $63,000 and described every rally as sold while price works that average. Overlay posts arguing the late-2021 rhyme is real still drew the contrast: then, little support until the mid-teens; now, price is described as sitting on a 2024 accumulation shelf around $60,000–$65,000, with a working rule that a weekly break below $60,000 would mean respecting the fear again. Newhedge’s 200-week moving-average heatmap updated near the same week printed the long average near about $63,054 — the same neighborhood as the social weekly-EMA debate.
Onchain research tightens the same idea. Galaxy’s June note framed October 2025 as the calmest top on record (MVRV peaking near 2.29), which left the network cost basis at roughly 43.7% of the all-time high — much closer to the peak than at prior cycle tops. In that report window the realized / cost-basis anchor sat near about $53,000, price had only briefly slipped under the 200-week average, and the authors argued a calm top raises the arithmetic floor even if the bottom may not yet be fully in. That is the opposite of “empty space.” It does not guarantee a bounce; it explains why a 2022-style free-fall narrative has more structural friction this time.
| Layer | Late 2021 → 2022 | Oct 2025 → mid-Jul 2026 |
|---|---|---|
| Peak class | Twin peaks; Nov ~$69K class high | Oct 6, 2025 ATH ~$125K daily / ~$126K session peaks |
| Shape language | Double top → multi-month collapse | Double top / bear flag / breakdown overlays dominate social |
| Drawdown so far | Ended near −77% into mid-teens | ~48–50% into mid-$60Ks (not a finished winter print) |
| Floor stack | Thin shelf; “empty space” lower | ~$60–65K 2024 shelf talk; weekly long MA ~$63K; cost basis far above 2022 lows |
| Structure risk | Cascading leverage + platform failures | ETF-era and higher cost basis raise friction — floor can still move if panic deepens |
Levels are observation windows, not targets. Live quotes: BTC · ETH.
What should crypto traders watch next?
Watch whether the shelf and long averages keep absorbing supply — or whether weekly structure fails and the overlay gets a second vote.
Scenario A — floor holds, waiting continues. Spot keeps defending the mid-$60Ks shelf language, weekly closes hold above the long-average band near ~$63K, and each failed rally is a digestion tape rather than a new impulse lower. In that path the “hardest part is waiting” frame stays correct: time and chop do more work than a single crash candle. Relative strength in majors can matter more than alt beta while the market tests whether the higher structural floor is real.
Scenario B — weekly structure fails under the shelf. A clean weekly break and hold under the ~$60K accumulation language re-opens the overlay fear: measured-move and cycle-calendar posts get louder, and research “floor can move” caveats matter because cost basis itself can fall if coins re-trade lower. That does not automatically print a 2022 mid-teens path — only that the “empty space is gone” defense needs a rebuild lower.
Scenario A fails quickly if weekly structure loses the shelf and rebounds cannot reclaim the long-average band. Scenario B fails quickly if breakdowns are bought aggressively and price reclaims and holds back above the weekly average stack. In both cases, treat viral overlays as a sentiment gauge — then verify against the floor stack that actually trades.
Final thoughts
Yes — the late-2021 silhouette is easy to see. No — a silhouette is not a finished forecast. The durable habit is the same on every cycle chart debate: separate the overlay that scares the timeline from the floor under spot, update both when weekly structure and long averages change, and keep Bitcoin’s liquid reference price in view rather than a single screenshot. The fractal is the fear; the floor is still the difference.