


The S&P 500 crossed 7,800 intraday on August 13 and finished at 7,798.99, only 1.01 points below the round-number milestone. That record does not prove the market has topped, but it raises the burden of proof: further upside now depends on earnings growth, a defensible valuation and broader participation.
The useful question is not “is 7,800 too high?” Price alone cannot answer that. The better test is whether the three supports beneath the index—profits, the multiple paid for those profits, and market breadth—keep improving together.
Key takeaways
- At 7,800, the index prices roughly 20.3–22.9× earnings across three major 2026–27 EPS estimates.
- More upside is easier to defend if earnings revisions rise and the rally broadens beyond mega-cap leaders.
- A top warning strengthens if breadth narrows while oil and Treasury yields keep valuation pressure high.
What actually happened when the S&P 500 reached 7,800?
The index cleared 7,800 during the August 13 session, but it did not close above it. Yahoo Finance historical data show an intraday high of 7,816.70 and a close of 7,798.99. Associated Press reporting attributed the 0.7% gain to easing wholesale inflation and strength in technology shares.
The follow-through was less convincing. The index closed at 7,785.76 on August 14 and 7,745.06 on August 17. That pullback does not define a top either; it simply turns 7,800 from a headline into a live test of whether buyers can sustain new highs.
Can earnings carry the index higher?
Yes—if forward profit estimates keep rising fast enough to offset the expensive starting valuation. Goldman Sachs Research projected S&P 500 earnings per share of $340 for 2026 and $385 for 2027, with AI-infrastructure beneficiaries producing roughly half of this year's earnings growth. J.P. Morgan Global Research used a stronger $350 estimate for 2026 when it raised its year-end target to 7,800.
Fidelity reported that March-quarter S&P 500 earnings rose 28% from a year earlier, including 14% growth when technology was excluded. That broader profit growth matters. If earnings outside the largest technology companies continue to improve, 7,800 rests on more than one crowded theme.
The bull case weakens if analysts begin cutting estimates across sectors. An index can hold a high multiple while earnings expectations rise; defending the same multiple becomes harder when the profit base falls.
What valuation is already embedded at 7,800?
At 7,800, the implied multiple ranges from about 20.3× to 22.9× depending on which forward earnings year investors use. The lower number uses Goldman's $385 estimate for 2027. The higher number uses its $340 estimate for 2026. J.P. Morgan's $350 estimate puts the index near 22.3×.
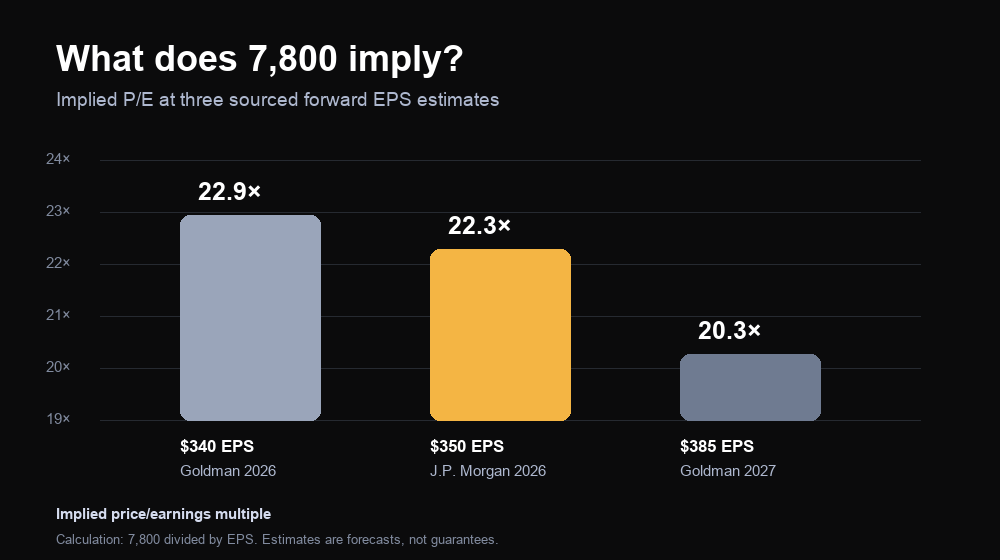
The chart divides 7,800 by each sourced EPS forecast. It compares assumptions; it does not predict the index.
That arithmetic explains why both bullish and cautious views can be reasonable. A 20.3× multiple on next year's earnings is demanding but close to the roughly 21× framework Goldman expects. A 22.9× multiple on this year's earnings leaves less room for higher yields, slower growth or disappointing AI returns.
Does a record high mean the market is at the top?
No. A record high by itself has not been a reliable sell signal. Chase counted 24 S&P 500 record highs through July 15 and noted that new highs often cluster. The same research also stressed that short-term outcomes remain mixed and pullbacks can occur during long bull markets.
The more useful distinction is confirmation. A durable breakout usually looks healthier when equal-weighted stocks, cyclical sectors and advance–decline measures participate. A fragile breakout relies on a shrinking group of very large companies to keep the cap-weighted index rising.
CMT Association research had already flagged a failure by the advance–decline line to confirm an earlier S&P 500 breakout. That does not time a reversal, but it makes breadth a necessary cross-check rather than a footnote.
Which signals would support more upside—or warn of a top?
Watch earnings revisions, valuation pressure and breadth together. No single row settles the question, but agreement across the three tests is more informative than the 7,800 level alone.
| Test | Supports continuation | Raises top risk |
|---|---|---|
| Forward earnings | $340–$385 estimates hold or rise across sectors | Broad estimate cuts, especially outside mega-cap technology |
| Valuation | 10-year yield stabilizes while profits do more of the work | Yields rise as the index still demands a premium multiple |
| Market breadth | Equal-weight and advance–decline measures confirm highs | A few leaders carry the cap-weighted index |
| Oil / inflation | Energy pressure cools and margins remain resilient | Oil stays high, lifting inflation and input-cost pressure |
| Price behavior | 7,800 is reclaimed and held with broader participation | Repeated rejection arrives alongside weaker earnings revisions |
The macro pressure can move quickly. On August 17, AP reported Brent crude at $90.87 and the 10-year Treasury yield at 4.72% as the S&P 500 fell 0.5%. Higher oil can squeeze margins and keep inflation sticky; higher yields can reduce the multiple investors will pay. When both rise together, the earnings bar at 7,800 becomes harder to clear.
For a related target framework, see the MC Markets analysis of what an S&P 500 move above 8,000 would require. For a broader cross-market view, see how inflation and AI earnings are shaping global indices.
Final thoughts
7,800 is better treated as a checkpoint than a verdict. The index can move higher if earnings estimates keep climbing and more of the market joins the advance. It can also become a meaningful top if profits soften while rates, oil and concentration all work against valuation. The level starts the test; earnings, valuation and breadth decide whether it passes.