


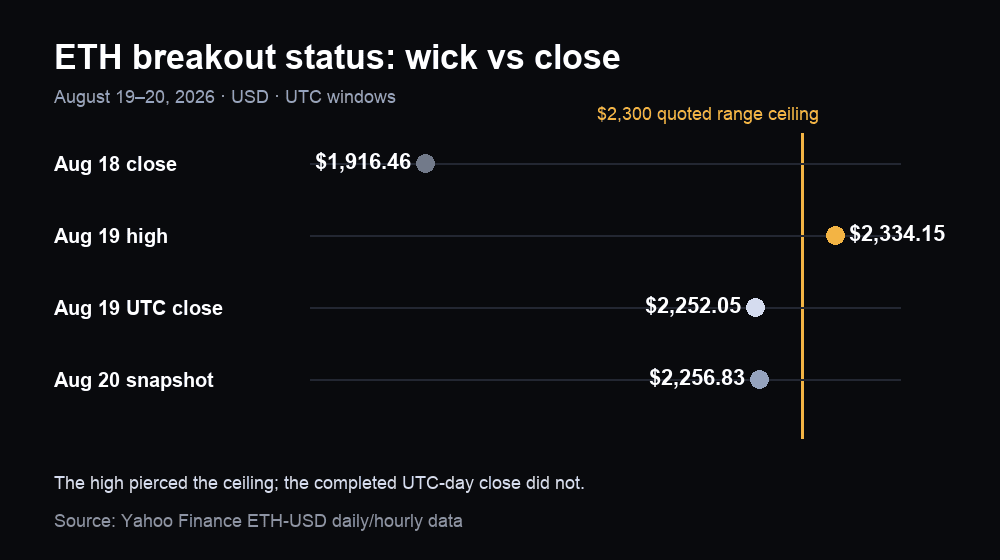
Ethereum finally reached the ceiling that crypto timelines had been watching. On August 19, 2026, ETH accelerated from the low $1,900s to an intraday high near $2,334, briefly clearing the widely quoted $2,300 boundary. The move was a genuine breakout test, but the first completed UTC-day close—near $2,252—did not confirm a daily close above that ceiling.
That distinction matters after an 18% session: a wick shows that price can trade through resistance; a close shows that buyers can keep it there; a retest asks whether the old ceiling can become support. For the current platform market, see the ETHUSDC product page. Bitcoin remains the broad risk reference on the BTC product page.
Key takeaways
- ETH pierced $2,300 intraday, but the August 19 UTC close near $2,252 stayed below the quoted ceiling.
- The “almost a year” range claim is overstated: Yahoo daily history shows the latest uninterrupted run of closes inside $1,500–$2,300 lasted 99 days.
- A stronger breakout needs a completed close above $2,300 and a stable retest; a fast loss of the $2,000–$2,100 breakout zone would weaken the structure.
Has Ethereum actually broken above $2,300?
Intraday, yes; on a completed daily-close basis, not yet in the first test. Yahoo Finance hourly data put the August 19 high near $2,334.15. The final hourly bar of that UTC day closed around $2,252.05, and the August 20 snapshot remained near $2,256.83 around 02:45 UTC. Price proved that the ceiling could be breached, then settled below it.
This is why “breakout” needs a timeframe. A one-minute, hourly or intraday break can be important for momentum, but it cannot substitute for a daily close when the original claim is based on a multi-month range. The cleaner status is breakout attempt in progress, not “$2,300 permanently cleared.”
The move still changed the chart. Before the surge, FXStreet had framed roughly $1,961 as nearby horizontal resistance, with higher structural references around $2,172 and $2,431. ETH crossed the first two during the rally. The market is no longer asking whether $2,000 can be touched; it is asking whether the move can hold above the old cluster and convert $2,300 from ceiling to floor.
Was ETH really trapped between $1,500 and $2,300 for almost a year?
No—the social hook captures the recent compression, but “almost a year” is not supported by the daily history. Yahoo Finance shows ETH closing near $4,831 on August 22, 2025, far above the quoted band. The latest uninterrupted run of daily closes inside $1,500–$2,300 began on May 12, 2026 and ran through August 18: 99 days, a little over three months.
There were earlier spells inside the band, interrupted by closes above $2,300. That still makes the range meaningful—especially because the June 25 close near $1,565 tested its lower edge—but it changes the narrative. This was not a year-long flat line suddenly waking up. It was a volatile post-peak market that compressed more consistently during the latest quarter.
The correction is useful for traders. The longer a range truly persists, the more positioning can accumulate around its edges. Overstating its duration encourages oversized conclusions from one move. A 99-day closing range can produce a forceful release; it does not make follow-through automatic.
What changed during the August 19 surge?
Broad risk appetite improved at the same time that leverage and crypto-specific policy headlines amplified the move. CoinDesk reported that the US Treasury doubled the size of its bond-buyback operations, which markets read as supportive for Treasury-market liquidity. Bitcoin rose about 6%, crypto equities climbed, and ETH outperformed; CoinDesk’s live panel later showed ether near $2,254.96, up about 18.29%.
Yahoo Finance also tied the earlier part of the session to proposed SEC rules for crypto-related capital raising and disclosure. The proposal—not a final rule—outlined registration exemptions and a route for some mature networks to move beyond securities classification after completing core managerial commitments. The timing helped the market frame Ethereum as a potential beneficiary, but the later acceleration was broad enough that liquidity and short covering also mattered.
Leverage confirms that this was not a quiet spot drift. CoinDesk, citing CoinGlass, said ETH open interest jumped from roughly $11.7 billion to $13 billion before easing to about $12.5 billion. That expansion adds participation, but it also raises the chance of sharp two-way moves when crowded positions unwind. A breakout powered partly by leverage needs the spot market to keep doing work after the squeeze slows.
What would confirm or reject the breakout?
Confirmation is a sequence: close above the ceiling, hold it on a retest, then retain participation. A completed daily close above $2,300 would remove the first ambiguity. If a later pullback holds around that former ceiling instead of slicing straight back through it, the market has evidence that sellers lost control of the boundary. Continued spot strength and orderly leverage would make that evidence stronger.
The bullish interpretation weakens if the move repeatedly wicks above $2,300 but closes below it. That pattern would show supply returning at the same boundary. A faster rejection through the former $2,172 reference and into the $2,000–$2,100 breakout area would suggest the surge outran its support. The close-and-retest framework is invalidated as a continuation signal if price cannot hold the zone it just reclaimed.
The opposite case also has an invalidation. A failed-break thesis becomes less persuasive if ETH closes above $2,300, retests it without heavy selling, and resumes higher with open interest stable rather than exploding. Both paths depend on observable behavior, not the confidence of the original post.
How should traders read the breakout state?
| Evidence | Observed window | What it says |
|---|---|---|
| Quoted range | $1,500–$2,300 | Useful recent compression band; “almost a year” is overstated |
| Pre-surge close | $1,916.46 on Aug 18 (Yahoo) | Starting point before the acceleration |
| Intraday high | $2,334.15 on Aug 19 UTC (Yahoo hourly) | Ceiling pierced |
| Completed UTC close | $2,252.05 on Aug 19 (Yahoo hourly reconstruction) | No first-day close above $2,300 |
| Aug 20 snapshot | About $2,256.83 at 02:45 UTC | Holding most of the surge, still below the ceiling |
| Leverage participation | ETH open interest $11.7B → $13B → $12.5B (CoinGlass via CoinDesk) | Participation expanded; two-way volatility risk also rose |
| Stronger confirmation | Daily close above $2,300, then stable retest | Former resistance starts behaving like support |
| Failure condition | Repeated closes below $2,300 and loss of $2,000–$2,100 | Breakout attempt becomes a rejection |
Crypto prices move continuously; every figure above is tied to its stated UTC window. Current ETH pricing is available on the MC Markets product page.
Final thoughts
The social post got one important thing right: Ethereum had built enough pressure for the range boundary to matter. It got the duration wrong, and the first close did not finish the job. That leaves a more useful story than either “breakout confirmed” or “nothing happened.” ETH delivered a powerful range test, cleared several stale resistance references, and held most of the surge. The next evidence is simple: where the daily close lands, and whether $2,300 survives its first serious retest.