


India’s benchmark indices finished lower on September 7 as crude oil remained close to $97 a barrel and US-Iran tension kept the cost of energy in focus. The most useful explanation is not “war headlines made stocks fall”; it is that expensive imported oil can pressure India through the trade bill, the rupee, inflation expectations and corporate margins.
The BSE Sensex closed at 76,132.81, down 382.62 points or 0.50%, while the Nifty 50 ended at 23,779.15, also down 0.50%, according to Business Standard’s September 7 close. Those matching headline declines conceal a more informative question: did the rest of the market confirm an oil-driven shock?
Key takeaways
- Nifty and Sensex both lost 0.50% while Brent was last near $96.60 in the cited session window.
- Oil matters through India’s import bill, dollar demand, the rupee, inflation and margins—not through one automatic index rule.
- Sector breadth, INR and global index futures help test whether the crude narrative is strengthening or fading.
Why did Nifty and Sensex fall on September 7?
Elevated crude and renewed concern about energy flows raised the macro cost of holding Indian risk assets, while weakness in major sectors confirmed that the pressure was broader than one oil-sensitive stock. Business Standard reported declines in IT, metals, PSU banks, realty and media; Nifty Pharma was the exception at the close. The Nifty Midcap 100 fell 0.46%, while the Nifty Smallcap 100 edged 0.02% higher.
That mixed breadth matters. A uniform liquidation would normally pull the large-cap benchmarks and smaller companies down together. Instead, September 7 showed pressure concentrated in large caps and several important sectors, while part of the small-cap universe held up. The session was risk-off, but not indiscriminate.
The timing also argues for precision. NDTV recorded an opening fall of 218 points in Sensex and 65 points in Nifty at 09:50 IST. By the close, both indices were down 0.50%. A live-blog headline captures the developing story; the closing figures reveal what the market ultimately retained.
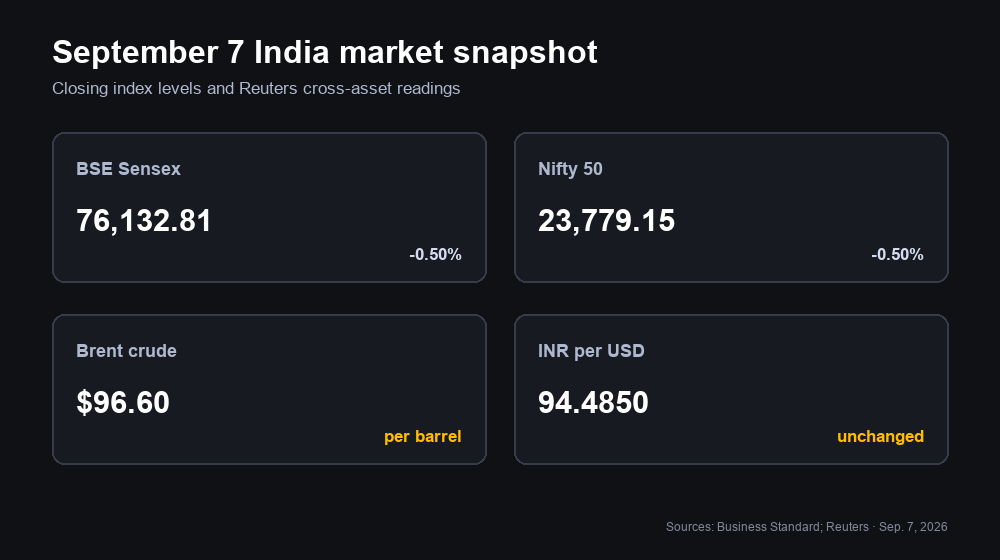
Index values are September 7 closes. Brent and INR are Reuters readings from the cited session window; intraday prices can differ.
Why does a crude-oil shock matter more for India?
India imports most of the crude it consumes, so a sustained oil-price rise can reach equities through several channels at once. The Government of India’s February 2026 Monthly Economic Review put crude import dependence at 88.6% for April–January FY26. It also reported that 46.9% of crude imports during that period came from the Middle East.
The first channel is the import bill. More expensive barrels require more dollars for the same physical volume, which can increase dollar demand and weigh on the rupee. The second is inflation. The same government review cited an RBI estimate that crude prices 10% above baseline could add 30 basis points to inflation under full pass-through. Separate RBI research estimated an approximately 20-basis-point contemporaneous lift to headline inflation from a 10% international crude increase, with possible second-round effects through INR depreciation.
The third channel is corporate margins. Airlines, paints, chemicals, logistics and other fuel- or feedstock-intensive businesses may face higher costs. Refiners and upstream energy companies can react differently because product spreads, regulated prices and inventory effects matter alongside the crude headline. That is why “oil up, Nifty down” is a starting hypothesis rather than a complete model.
On September 7, Reuters reported Brent at $96.60 a barrel and the rupee closing at 94.4850 per dollar, unchanged from Friday after spending the day in a roughly 10-paise range. Traders cited dollar sales from state-run banks, most likely on behalf of the RBI. A stable closing rupee therefore did not prove that the oil pressure had disappeared; intervention may have damped the visible move.
Which sectors reveal whether oil is really driving the index?
Financials, energy and IT provide three different tests because they connect to crude through different mechanisms. NSE Indices’ 2026 Nifty 50 review identified Financial Services, Oil, Gas & Consumable Fuels, and Information Technology as the index’s three largest sector weights as of February 27. Their combined behaviour can explain much more than the headline index percentage.
Financials reflect the rates, inflation and growth path. If expensive energy pushes inflation expectations higher, the policy outlook and credit quality can become more important. Energy shares split between producers, refiners and fuel marketers, so crude is not a one-direction signal for the entire group. IT exporters can receive a translation benefit from a weaker rupee, but their shares also depend on US demand, global technology sentiment and company-specific earnings.
September 7 illustrates the distinction. IT was among the weakest groups even though the rupee finished unchanged, suggesting that oil and FX alone were not sufficient explanations for every stock move. Pharma and healthcare outperformed, consistent with a defensive rotation, while small caps were almost flat. The cleaner reading is a macro headwind interacting with sector-specific positioning—not a single-variable market.
What would confirm—or contradict—the oil-shock explanation?
Confirmation requires the cross-asset chain to persist; contradiction appears when crude, INR, sectors and global risk stop telling the same story.
| Evidence to monitor | Oil-shock reading strengthens if… | It weakens if… |
|---|---|---|
| Brent crude | Prices hold near the session highs or extend as physical-flow concerns worsen | The risk premium fades and crude gives back the move |
| USD/INR | Dollar demand pushes the rupee weaker despite support | The rupee stabilises without visible intervention pressure |
| Indian sector breadth | Financials and fuel-sensitive cyclicals join the decline | Weakness stays isolated to company-specific or global-tech stories |
| Defensive rotation | Healthcare and other defensives keep outperforming | Broad participation returns across cyclicals and smaller companies |
| Global indices | US500 and other broad benchmarks price the same inflation-and-rates concern | Global indices remain firm while India-specific pressure persists |
These are diagnostic relationships, not fixed correlations. On the same global session, the Associated Press reported the Nikkei 225 up 2.1% and the Kospi up 4.6%, while S&P 500 futures were little changed and Dow futures were down 0.3%. That divergence shows why a trader should not compress every Asian market into one geopolitical trade.
What should global index and crypto traders watch next?
Watch whether the Indian oil-importer stress spreads into broader inflation, rates and risk positioning when US liquidity returns. September 7 was the US Labor Day holiday, so cash equities and bonds were closed. Thin or partial cross-market signals deserve less confidence than a move confirmed after the full US session reopens.
For global equity context, the verified US500 product page provides the broad US index cross-check used in this article. MC Markets’ earlier analysis of oil-driven pressure on Nasdaq futures explains why growth-heavy indices can respond differently, while its review of oil declines during de-escalation shows the reverse side of the transmission chain.
Crypto traders can use the same framework without assuming a mechanical link. If oil remains high, rates expectations firm and broad equity volatility rises, high-beta digital assets may face a tighter risk environment. If Bitcoin diverges while equity and currency stress persist, that divergence is information about crypto-specific liquidity or positioning—not proof that the macro shock is irrelevant.
Final thoughts
The September 7 decline was meaningful because expensive crude met India’s structural import dependence, not because one headline dictated the direction of Nifty or Sensex. The next useful read comes from agreement across Brent, INR, sector breadth and global indices. When those signals diverge, the disciplined response is to narrow the claim—not force the market into a simpler story than the evidence supports.