


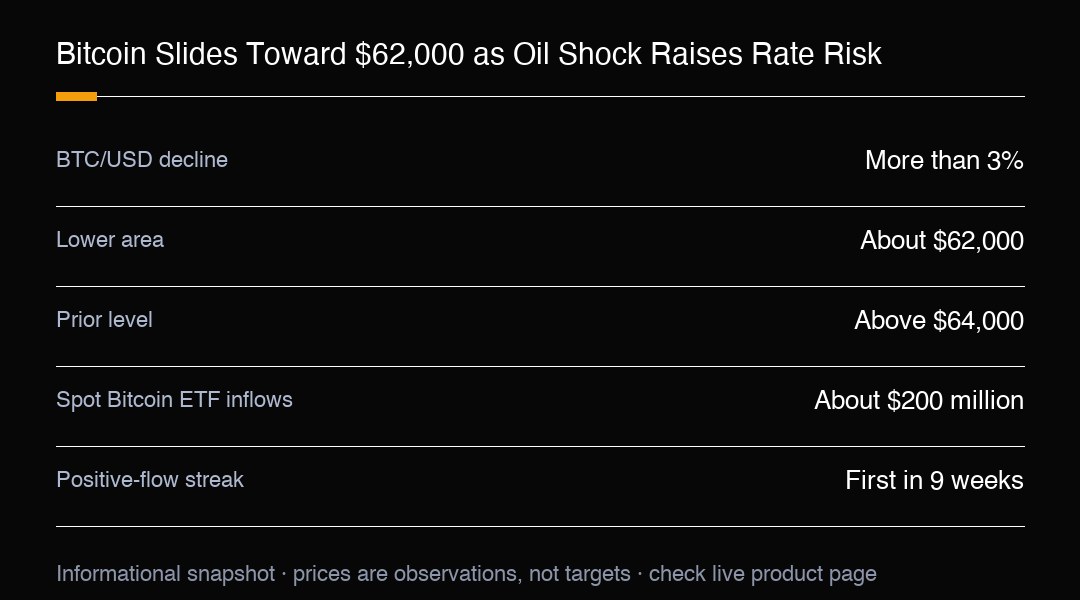
Bitcoin fell more than 3% in Asian trading, sliding toward $62,000 after briefly holding above $64,000. The trigger was a fresh wave of geopolitical tension that sent risk assets lower across the board. For BTC/USD, the move is a macro-liquidity story first and a crypto story second: when oil surges and rate expectations rise, speculative assets are often the first to be sold.
The mechanics are straightforward but not mechanical. Higher oil can lift inflation expectations, inflation expectations can lift rate pricing, and higher expected yields can drain demand from non-yielding assets like Bitcoin. The relationship can break on any single day, but the direction is the part traders should respect when sizing positions.
The move toward $62,000 matters because it sits below the level where buyers had recently defended price. A brief dip under a round number can be noise, yet a sustained break tells traders the market is accepting a lower range. A recovery back above $64,000 would suggest the shock is being absorbed and that dip buyers are willing to rebuild exposure.
This week's US CPI report is the next macro test. A hotter reading could strengthen the case for another rate hike before year-end and keep pressure on highly valued assets. A softer print could support a relief bounce, though it would not by itself remove geopolitical risk or restore a broad risk-on trend.
Fed communication adds another layer. Testimony from Fed Chair Kevin Warsh can move rates before new data arrives, and Bitcoin often reacts through the dollar and Treasury market before it reacts in its own price. A positive BTC/USD move that fades while yields keep rising would warn that macro pressure remains stronger than short-term buying.
Not everything is negative. US-listed spot Bitcoin ETFs attracted roughly $200 million in net inflows last week, the first positive weekly flow in nine weeks. That flow does not guarantee a recovery, but it complicates a purely bearish read. Strategic demand can coexist with tactical selling, which means a selloff can be both vulnerable and supported.
The ETF flow also changes how traders should frame the dip. Nine weeks of outflows had reinforced the bearish case, so a single positive print does not mark a trend, but it does show that larger allocators are still willing to add at these levels. The question is whether the flow can persist through a period of oil-driven volatility. Sustained inflows would argue that the $62,000 area is being treated as a strategic entry, while a quick return to redemptions would confirm that tactical sellers remain in control.
Positioning into the move matters as much as the price. A market that enters a shock with crowded longs tends to fall faster, because leverage has to be unwound before any recovery can begin. A market that enters already de-risked can stabilise more quickly because the weak hands have already exited. Bitcoin's recent range suggests neither extreme, which is why the reaction around $62,000 is informative: it shows whether participants are adding or reducing when given a reason to choose.
The risk is assuming one supportive signal cancels the wider shock. ETF inflows can slow or reverse, and a geopolitical headline can change the picture faster than details are confirmed. Bitcoin's sensitivity to weekend and Asian-session liquidity adds another layer of gap risk that warrants smaller, well-defined positions.
Market structure can amplify the first move. A fall toward a round number tends to attract both dip buyers and stop orders, so the initial reaction around $62,000 may be unusually noisy. If funding, open interest, and correlated tech assets all move together, an early bounce may reflect short covering rather than fresh conviction.
The cross-asset context is the part to watch after the initial shock fades. Bitcoin rarely moves in isolation when oil and rates are the active drivers, so the direction of the dollar and the shape of the Treasury curve will help confirm whether the crypto move was a one-off risk event or the start of a longer repricing. If yields resume higher while equities stay soft, Bitcoin is more likely to struggle; if the macro data turns supportive, the $200 million ETF flow could mark the early stage of a base.
The cleanest read for now is that Bitcoin is in a wait-and-see posture. The more than 3% drop toward $62,000 was a clear risk-off impulse, but the $200 million ETF inflow shows the market is not uniformly bearish. Traders can use the $62,000 and $64,000 levels as a live map of that debate: a defense of $62,000 with a push back to $64,000 signals dip buyers remain, while a loss of $62,000 would say the macro shock is still being priced. Neither outcome is a forecast, but both are observable.
For BTC/USD traders the framework is simple but conditional. Holding near $62,000 while pushing back toward $64,000 would suggest the macro shock is being treated as temporary. Failure to reclaim the higher level, followed by acceptance below $62,000, keeps downside momentum in control. Price still needs to show demand can absorb the risk reduction.
MC Markets traders can use BTCUSDC to take a view on this balance between short-term risk aversion and strategic demand. The more than 3% decline toward $62,000, after a hold above $64,000, keeps rate risk and geopolitics front of mind, while the $200 million ETF inflow shows longer-term interest has not vanished. This is market commentary, not personal financial advice.
Trading Insight
BTC/USD slid more than 3% toward $62,000 after holding above $64,000, as renewed geopolitical tension and higher oil revived rate-risk concerns. This week's CPI is the next catalyst, with Fed commentary also in focus. Roughly $200 million of spot Bitcoin ETF inflows, the first positive weekly flow in nine weeks, shows strategic demand persists. Watch $62,000 and $64,000. This is market commentary, not personal financial advice.